Overview of the Planococcus halocryophilus genome and proteome
Aleksandra S. Parfenova
Faculty of Bioengineering and Bioinformatics, Lomonosov Moscow State University, Moscow, Russia
KEY WORDS
Planococcus halocryophilus, python, google sheets, genome, proteome.
1 INTRODUCTION
Planococcus halocryophilus is a species of non-spore forming gram-positive aerobic heterotrophic bacteria. Isolated from high Arctic permafrost, P. halocryophilus most likely inhabits the subzero brine veins surrounding soil particles and ice crystals. This species is notable for its ability to grow at temperatures as low as - 15°C and withstand NaCl concentrations up to 19% (Mykytczuk et al., 2013).
P. halocryophilus classification:
Kingdom: Bacteria
Phylum: Firmicutes
Class: Bacilli
Order: Bacillaes
Family:Planococcaceae
Genus: Planococcus
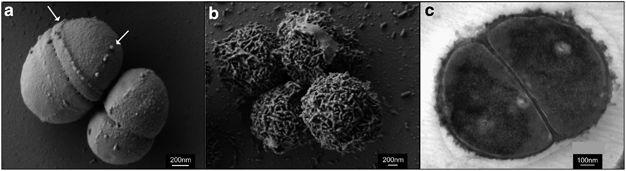
Previous studies of the genomes of eurypsychrophilic bacteria (i.e. those bacteria that grow in low temperatures, but can also tolerate a wide temperature range) such as the subject of this review have been focused on determining the mechanisms these bacteria employ in order to survive conditions of low temperature and high salinity. For example the Mykytczuk et al., 2013 study found that a special encrustation forms around individual cells at low temperatures (Figure 1). Raymond‐Bouchard et al., 2017 found that protein make-up of the cells varied between -10 °C with 12 w/v NaCl, 23 °C and 23 °C with 12% w/v NaCl conditions. Some proteins were abundant both at -10 °C and 23 °C+NaCl conditions thus indicating a link between low temperature and high salinity adaptations. These studies have furthered our understanding of the genetic mechanisms P. halocryophilus and other cryophilic bacteria use in order to withstand low temperature and high salinity conditions. The purpose of this review is to determine the basic structure and makeup of the P. halocryophilus genome and proteome.
2 METHODS
This overview is based on genome and CDS files available at NCBI database. Genome length, nucleotide frequency, start-codon, stop-codon and amino acid coding codon usage was calculated using Python scripts, written with Google Colaboratory.
Proteome data was calculated using Google Sheets functions COUNTIFS (protein length distribution, tRNA strand distribution), COUNTIF (RNA strand distribution) MAX (maximal protein length), MIN (minimal protein length), VLOOKUP (codon usage table, longest and shortest protein), AVAGARE (average protein length), MEDIAN (madian protein length) SUM (tRNA strand distribution). The protein length distribution histogram (Figure 2), codon usage table (Table 4), tRNA genes table (Table 5) were made using Google Sheets build-in functions. The Cumulative GC-skew plot was made using Webskew.
3 RESULTS AND DISCUSSION
3.1 GENOME LENGTH AND NUCLEOTIDE FREQUENCY
The total length of the P. halocryophilus genome amounts to 3424893 base pairs. Only adenine, thymine, guanine and cytosine nucleotides were found. The GC-content and the AT-content are 40.5% and 59.95% respectively. Since the frequency of guanine is only 0.17% higher than that of cytosine and the frequency of thymine only 0.05% higher than that of adenine it can be confidently stated that the second Chargaff’s rule applies to the P. halocryophilus genome. Precise data on nucleotide frequency is shown in Table 1.
| Nucleotide | Total amount | Frequency, % |
|---|---|---|
| A | 1025615 | 29.95 |
| T | 1027570 | 30.00 |
| G | 688770 | 20.11 |
| C | 682938 | 19.94 |
3.2 VARIATION IN START- AND STOP-CODON USAGE
P. halocryophilus has 11 different start-codons. Out of those the most frequent are ATG, TTG and GTG in descending order.
99.08% of the P. halocryophilus sequences end with typical TAA, TGA and TAG stop-codon, TAA being the most common, comprising 64.92% of all stop-codons. However, 0.92% of the analysed sequences end with nontypical nucleotide sequences such as A, AA, GA, AG, G and CAG. The presence of those can most likely be explained by either a deletion of one or two nucleotides in the stop-codon itself or, alternatively, a frameshift mutation somewhere along the rest of the coding sequence. Precise data on start- and stop-codon usage is shown in Table 2 and Table 3 respectively.
| Start-codon | Amount | Frequency, % |
|---|---|---|
| ATG | 2669 | 81.65 |
| TTG | 306 | 9.361 |
| GTG | 245 | 7.495 |
| ATT | 22 | 0.673 |
| ATA | 12 | 0.367 |
| other | 15 | 0.454 |
| Stop-codon | Amount | Frequency, % |
|---|---|---|
| TAA | 2122 | 64.91 |
| TGA | 712 | 21.78 |
| TAG | 405 | 12.39 |
| other | 30 | 0.92 |
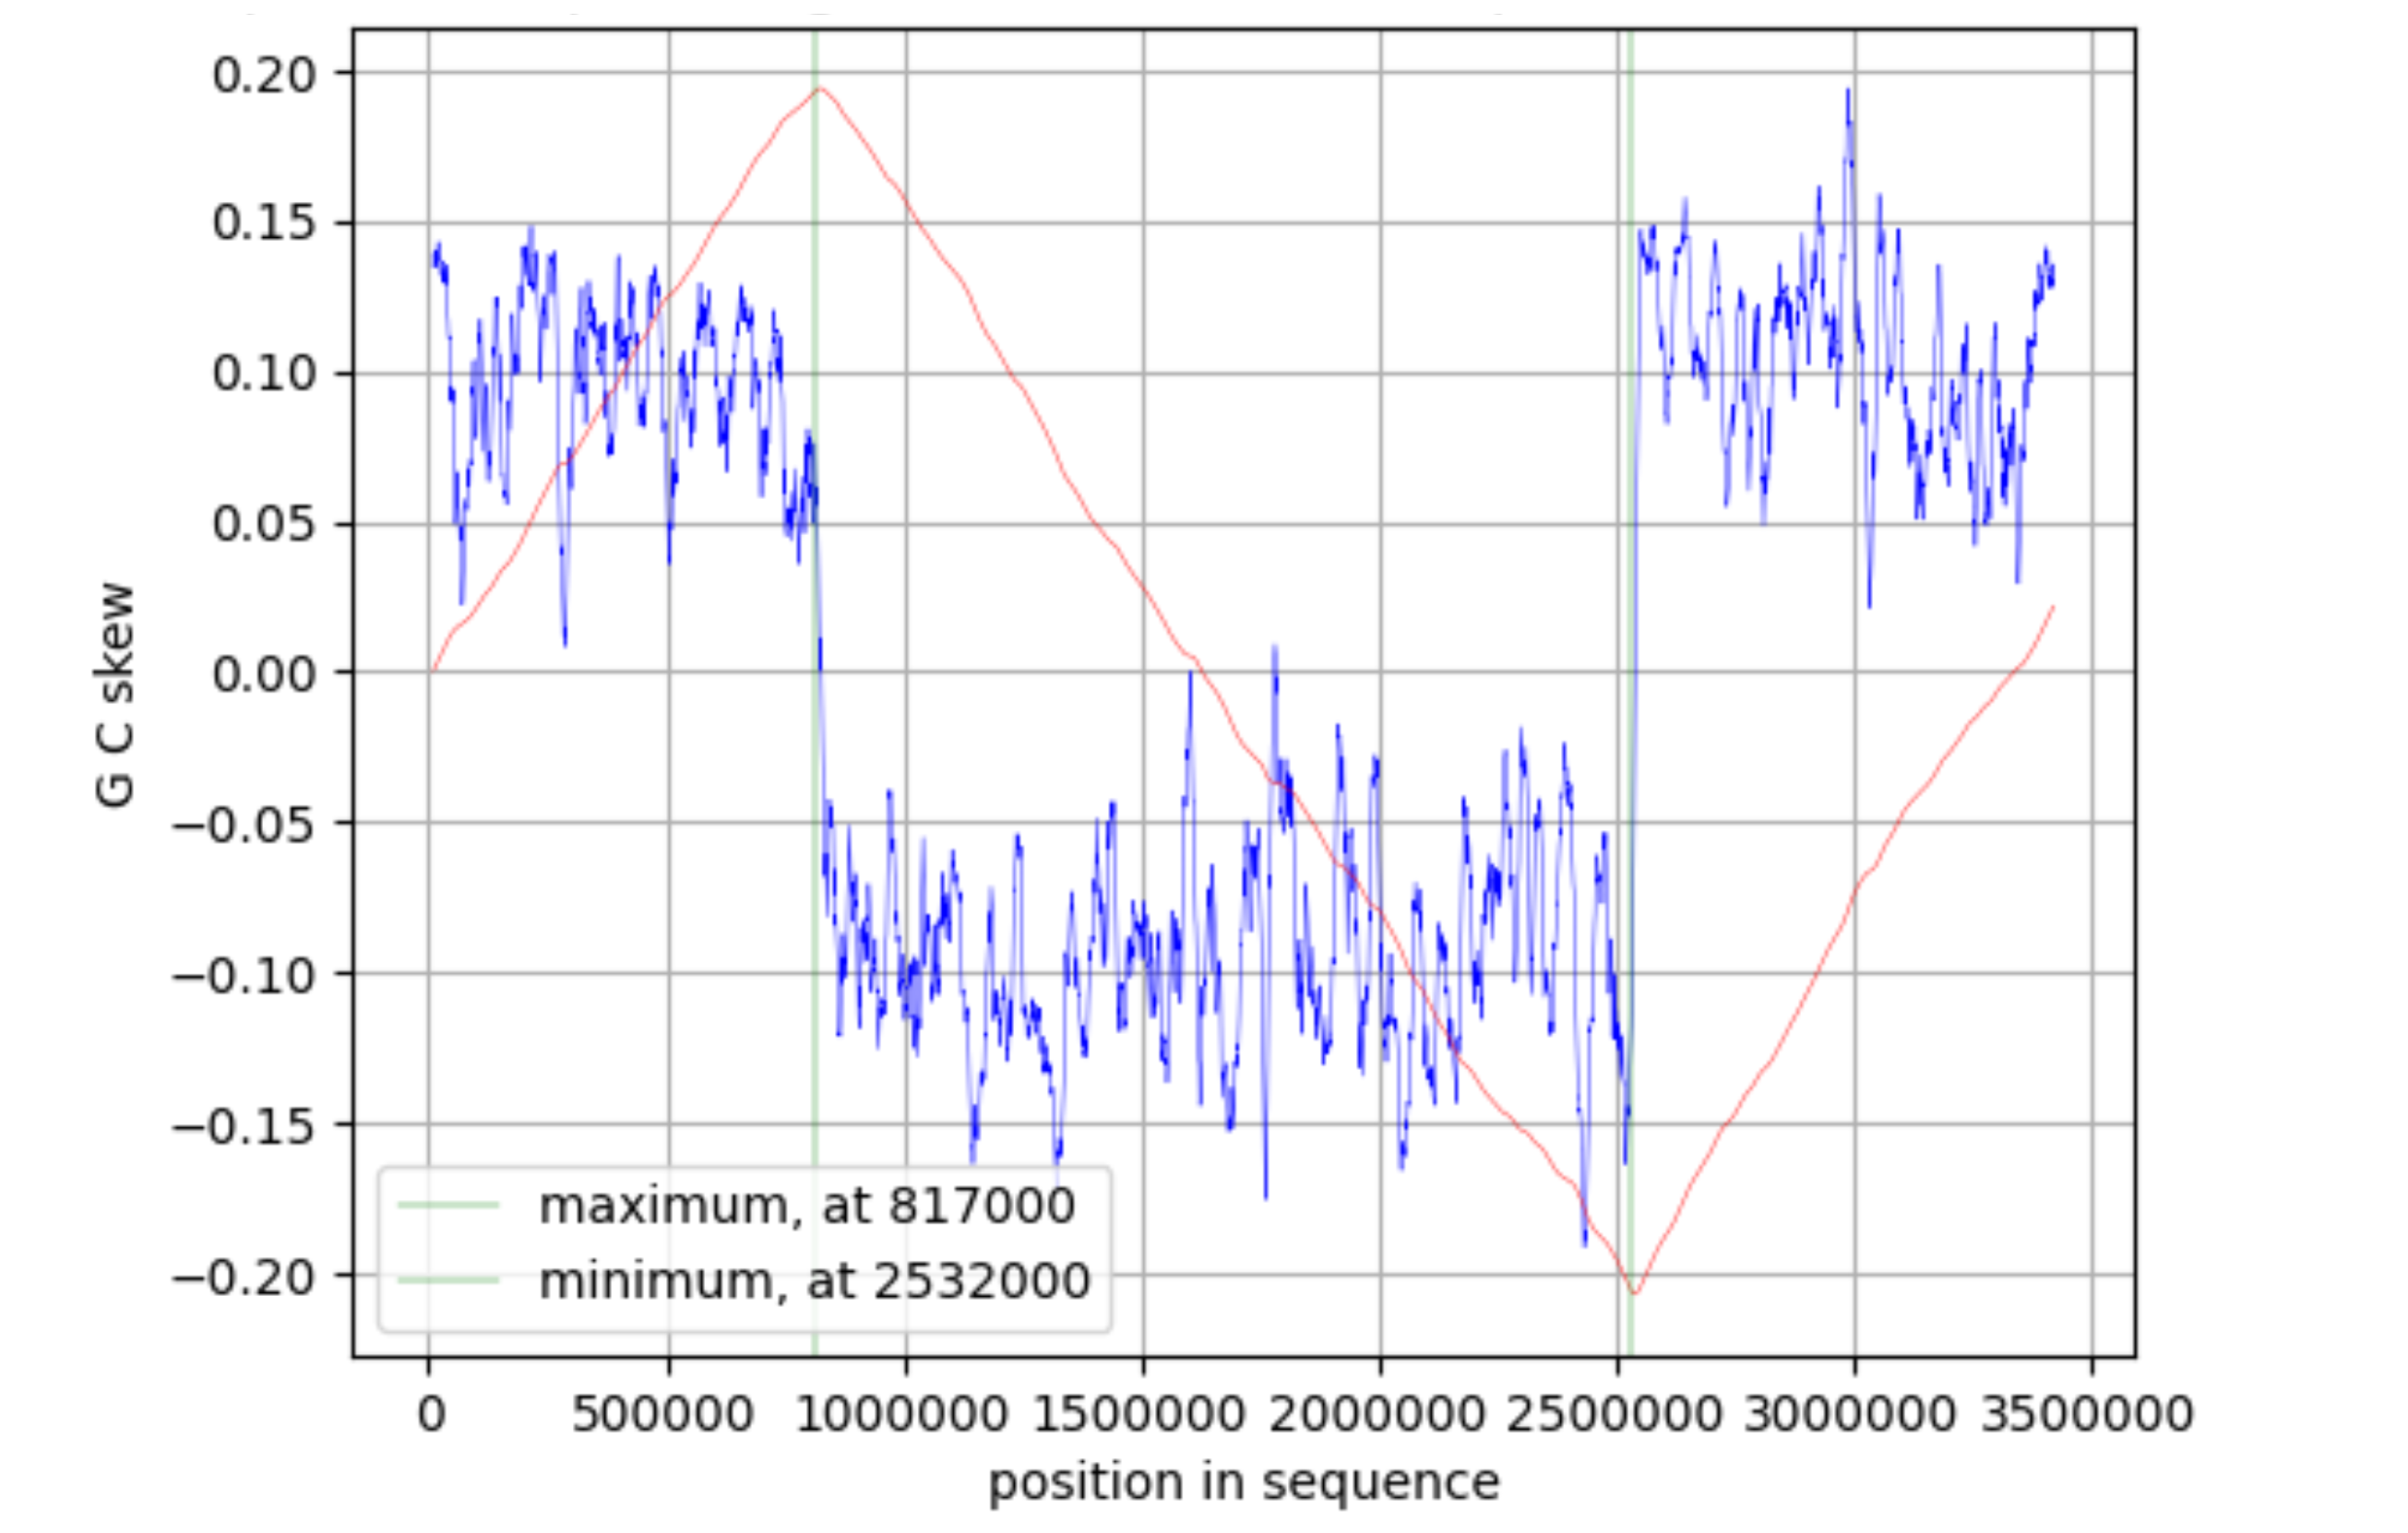
3.3 CUMULATIVE GC SKEW, OriC AND TER LOCATION
The Cumulative GC-skew plot (Figure 3) was made using Webskew application. Stepsize and windowsize were specified as 1000 and 20000 respectively. The cumulative GC-skew minimal value resides over the replication origin and maximal value – over the terminus (Grigoriev, 1998). Hence, it can be concluded that the replication origin of P. halocryophilus lies around the 2532000 mark and the terminus around 817000.
3.4 PROTEOME STATISTICS
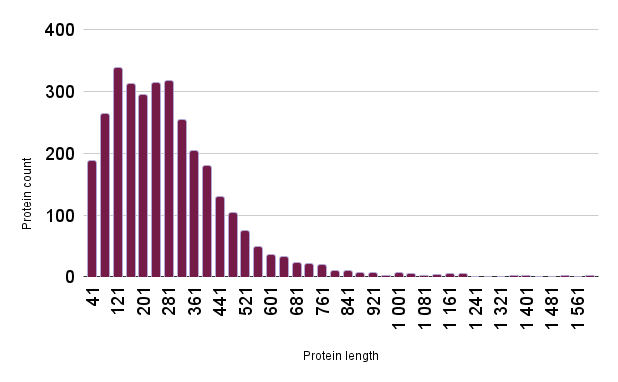
There are a total of 3219 proteins encoded by the P. halocryophilus genome. The average protein length is 299 amino acids long, which is 6.56% less than the average length of bacterial proteins (Tiessen, A., Pérez-Rodríguez, P. & Delaye-Arredondo, L.J.). The median length is 266 aa.See Figure 2 for a histogram of protein length distribution.
The shortest protein found is stressosome-associated protein Prli42. This protein is composed of 31 amino acids and is a membrane-bound mini-proteine, a part of the stressosome activation mechanism (Williams et al., 2019). The longest protein is a phage tail protein. It is 1921 amino acids long and is probably a prophage.
3.4 AMINO ACID CODON USAGE AND RNA GENES STRAND DISTRIBUTION
All 61 amino acid coding codons were found. For each amino encoded by 2 or more codons there is a clear difference in frequencies of the codons (see Table 4). Hence, the P. halocryophilus genome shows codon bias.
Although all codons are present, it seems that P. halocryophilus has a nontypical “translation table”. Notably, arginine, cysteine, proline and serine have fewer tRNA genes than the standard number of codons (as shown in Table 5). This lack of tRNA genes is probably due to wobble base pairing. Especially since arginine, proline and serine are all encoded by NN_ template codons (Cox et al., 2013).
Another possibility is that since several amino acids have more tRNA genes than the standard number of codons, it may be that some of those abundances can be explained by codons being assigned to different amino acids. However, for some amino acids extra tRNA genes presence can probably be explained by their high commonness in proteins (e.g. methionine, being the most frequent start-codon).
| aa* | 1st codon | 2nd codon | 3rd codon | 4th codon | 5th codon | 6th codon | ||||||
|---|---|---|---|---|---|---|---|---|---|---|---|---|
| codon | usage | codon | usage | codon | usage | codon | usage | codon | usage | codon | usage | |
| Ala | GCT | 23113 | GCA | 28657 | GCC | 9205 | GCG | 14944 | - | - | - | - |
| Arg | AGA | 5745 | AGG | 1182 | CGA | 6568 | CGT | 13609 | CGG | 3482 | CGC | 8556 |
| Asn | AAT | 24073 | AAC | 14960 | - | - | - | - | - | - | - | - |
| Asp | GAT | 35273 | GAC | 15488 | - | - | - | - | - | - | - | - |
| Cys | TGC | 2237 | TGT | 3541 | - | - | - | - | - | - | - | - |
| Gln | CAA | 28878 | CAG | 8347 | - | - | - | - | - | - | - | - |
| Glu | GAA | 60871 | GAG | 14215 | - | - | - | - | - | - | - | - |
| Gly | GGA | 21114 | GGG | 8299 | GGT | 21293 | GGC | 17369 | - | - | - | - |
| His | CAT | 13594 | CAC | 6017 | - | - | - | - | - | - | - | - |
| Ile | ATA | 9165 | ATT | 42696 | ATC | 21191 | - | - | - | - | - | - |
| Leu | TTG | 23913 | CTT | 16470 | TTA | 33060 | CTC | 5765 | CTA | 9842 | CTG | 7206 |
| Lys | AAG | 11565 | AAA | 49643 | - | - | - | - | - | - | - | - |
| Met | ATG | 27854 | - | - | - | - | - | - | - | - | - | - |
| Phe | TTC | 13512 | TTT | 31278 | - | - | - | - | - | - | - | - |
| Pro | CCT | 9623 | CCA | 14404 | CCC | 2343 | CCG | 9020 | - | - | - | - |
| Ser | AGC | 7970 | AGT | 11210 | TCA | 13977 | TCT | 13041 | TCC | 4307 | TCG | 8532 |
| Thr | ACT | 12695 | ACA | 21893 | ACG | 13011 | ACC | 7398 | - | - | - | - |
| Trp | TGG | 9872 | - | - | - | - | - | - | - | - | - | - |
| Tyr | TAT | 20921 | TAC | 10974 | - | - | - | - | - | - | - | - |
| Val | GTT | 25276 | GTA | 19068 | GTG | 13530 | GTC | 12381 | - | - | - | - |
| Ala | Arg | Asn | Asp | Cys | Gln | Glu | Gly | His | Ile | |
|---|---|---|---|---|---|---|---|---|---|---|
| tRNA | 5 | 5 | 3 | 5 | 1 | 3 | 4 | 5 | 2 | 4 |
| tRNA neg | 0 | 0 | 0 | 0 | 0 | 0 | 0 | 0 | 0 | 0 |
| tRNA pos | 5 | 5 | 3 | 5 | 1 | 3 | 4 | 5 | 2 | 4 | Leu | Lys | Met | Phe | Pro | Ser | Thr | Trp | Tyr | Val |
| tRNA | 7 | 3 | 5 | 2 | 2 | 4 | 4 | 1 | 2 | 5 |
| tRNA neg | 0 | 0 | 1 | 0 | 0 | 1 | 0 | 0 | 0 | 0 |
| tRNA pos | 7 | 3 | 4 | 2 | 2 | 3 | 4 | 1 | 2 | 5 |
ACKNOWLEDGEMENTS
I extend my gratitude to our amazing teachers for all the knowledge and skills they have given us this semester. As well as to my classmates for their encouragement and advice in writing this overview. Special thanks to Mikhail Khandokhin, who kindly provided a template for the codon usage table. May your Hirsch index increase exponentially.
REFERENCES
Google Drive folder with related material i.e. Python script, spreadsheets, genome and CDS files.
Mykytczuk, N., Foote, S., Omelon, C. et al. Bacterial growth at −15 °C; molecular insights from the permafrost bacterium Planococcus halocryophilus Or1. ISME J 7, 1211–1226 (2013).
Raymond‐Bouchard, I. et al. Mechanisms of Subzero Growth in the Cryophile Planococcus halocryophilus Determined through Proteomic Analysis. Freshwater Biology, Wiley/Blackwell (10.1111), 13 Oct. 2017
Tiessen, A., Pérez-Rodríguez, P. & Delaye-Arredondo, L.J. Mathematical modeling and comparison of protein size distribution in different plant, animal, fungal and microbial species reveals a negative correlation between protein size and protein number, thus providing insight into the evolution of proteomes. BMC Res Notes 5, 85 (2012).
Williams AH, Redzej A, Rolhion N, Costa TRD, Rifflet A, Waksman G, Cossart P. The cryo-electron microscopy supramolecular structure of the bacterial stressosome unveils its mechanism of activation. Nat Commun. 2019 Jul 8;10(1):3005. doi: 10.1038/s41467-019-10782-0. PMID: 31285450; PMCID: PMC6614362.
Andrei Grigoriev, Analyzing genomes with cumulative skew diagrams, Nucleic Acids Research, Volume 26, Issue 10, 1 May 1998, Pages 2286–2290.
Cox, Michael M.; Nelson, David L. (2013). "Protein Metabolism: Wobble Allows Some tRNA's to Recognize More than One Codon". Lehninger Principles of Biochemistry (6th ed.). New York: W.H. Freeman. pp. 1108–1110. ISBN 9780716771081