Mini-review of the genome and proteome of archaea Saccharolobus shibatae B12
Elena Neverova-Simchit1
1Faculty of Bioengineering and Bioinformatics, 1-73, MSU, Leninskiye Gory, GSP-1, Moscow, 119991; budbe3dzgwdo@mail.ru
Abstract: What can you learn from a single prokaryote using only computational methods and results of previous studies? You will see by the end of this mini-review. We had chosen an archaea species Saccharolobus shibatae B12 to study its genome and proteome. All materials we had either found on open internet resources, either received them through modifying data collected from the former source. We worked with Python, Google Sheets, Bash and even notebooks. In the end most of our results had been achieved before us, so it can be safely said that we confirm previously received information. In this mini-review I would point out the finding of correlation between the maximum GC-content in the genome sequence and the gene product in that section. Other characteristics of the genome and proteome were also studied. Results, where convenient, are presented in visual forms.
Keywords:archaea; genome; proteome; GC-content.
1. Introduction
Saccharolobus shibatae, an archaeal species belonging to the phylum Thermoproteota, was described for the
first time as Sulfolobus shibatae in 1990, after being isolated from geothermal pools in Beppu, Japan. The isolate
B12 and its endogenous virus-like element SSV1 have provided a system for detailed analysis (Grogan et al.,
1990). Like all members of Sulfobaceae isolated so far this organism is a thermoacidophile adapted to low pH
environments and high temperatures (Albers et al., 2014). S. shibatae can grow in complex organic compounds
and in sugars, it is either a heterotrophic or mixotrophic archaeon (Grogan et al., 1990). It was transferred from
the genus Sulfolobus to the new genus Saccharolobus in 2018 (Sakai, Kurosawa, 2018). The archaea genome was
studied in research dedicated to reverse gyrases and their association with type I-5′ DNA topoisomerase family
(Jaxel et al., 1996).
In this review the proteome and genome of archaea Saccharolobus shibatae B12 is studied, results are analyzed,
discussed from the points of previous studies and conclusions are made based on the received results.
2. Materials and Methods
Materials used to conduct research include files received from National Centre of Biotechnological information
S1 containing data about genome DNA sequences of S. shibatae S2, genome feature table S3 and table
of feature counts S4, GenBank file S7. S5 contain programs written in Python: programs 1 for DNA molecule
composition and GC-content. S6 contain 4 figures in which plots of guanine, cytosine and GC-content distribution
are presented. S8 contains lines extracted from GenBank S7 that were used for GC-content analysis. Histogram
of protein lengths is presented in sheet “Histogram” S9, number of proteins encoded in each of the DNA
strands, statistical significance and relevant figures are presented in sheet “Randomness” S9, statistical information
for encoded in gene proteins can be found in sheet “Statistics” S9, sheet “CDS” was used as a data base
formed from feature table S3. Table of proteome analysis S10 shows lists of all, ribosomal, hypothetical, transporter
proteins on respective sheets, all data can be found in sheet “CDS” formed from feature table S3, sheet
“Protein Analyse” contains amounts of mentioned above proteins and relevant figures. Table of RNA analysis
contains data on this subject excluded from feature table S3, information about all RNA, rRNA, tRNA genes is
stored in respected sheets, the sheet “Analysis” is devoted to comparing amounts of each group of these genes.
Table of gene distribution S12 contains similarly named sheets devoted to all genes, genes on the forward and
reverse strands and sheet “Analysis” where comparison results can be seen.
Methods include use of Google Sheets for data display and functions available in the program, a high-level
programming language Python. Google Sheets were used in proteome analysis for building histograms, calculating
statistical information, including statistical significance of distribution of product lengths and genes on
DNA strands, finding amounts of certain protein types and RNA gene types. Search function of notepad was
used when analyzing GC-content using GenBank S7. Unix shell and command language Bash was used to determine
amount and names of separate DNA molecules in the genome from fasta file S2, the length of the longest
gene products from feature table S3. Python was used in GC-content study and consists of 2 program blocks,
the first one of them dividing into sections for general DNA research, GC-content analysis and plot building
and the search of maximum and minimum points, the second program block is devoted towards the nucleotide
frequency calculation, data from fasta file S2 was used.
3. Results
3.1.Standard information
The genome of Saccharolobus shibatae B12 consists of two ring DNA molecules: chromosome and plasmid
pB12E5. The chromosome consists of much more base pairs than the plasmid, which is a typical situation for
living organisms (see Table 1). Genome size of the prokaryote, being approximately 2.9 Mb, is higher than the
general of 1.6 Mb for archaea. Such genome size fits the range of genome sizes (2.47–2.85 Mb) for the genus
Sulfolobus (Nicholas et al., 2018).
The amounts of coding sequences on both DNA strands were compared, sheet “Analysis” table of gene
distribution S12. The number of genes on the forward strand was only slightly bigger than that of genes on the
reverse strand and statistical significance showed that such differences do not go beyond the norm.
| DNA molecule | b.p. | GC-content |
|---|---|---|
| Chromosome | 2879035 | 35.3594% |
| Plasmid pB12E5 | 37840 | 35.5946% |
| Total | 2916875 | 35.3624% |
The number and frequency of all four nucleotides on the forward DNA strands were calculated (program 2 S5) and are presented in Table 2. It can be seen that the overall amounts of adenine and thymine are nearly equal to each other, along with the approximate equality of guanine and thymine numbers. The GC-content (guanine-cytosine content) for each DNA molecule has also been calculated (program 1 S5,) the results are presented in Table 1. In this case overall GC-content is not very large.
| Nucleotide | Chromosome | Plasmid pB12E5 | Total |
|---|---|---|---|
| A | 32.47% | 31.97% | 32.46% |
| T | 32.17% | 32.43% | 32.18% |
| G | 17.85% | 18.19% | 17.85% |
| C | 17.51% | 17.41% | 17.51% |
3.2. More about GC-content
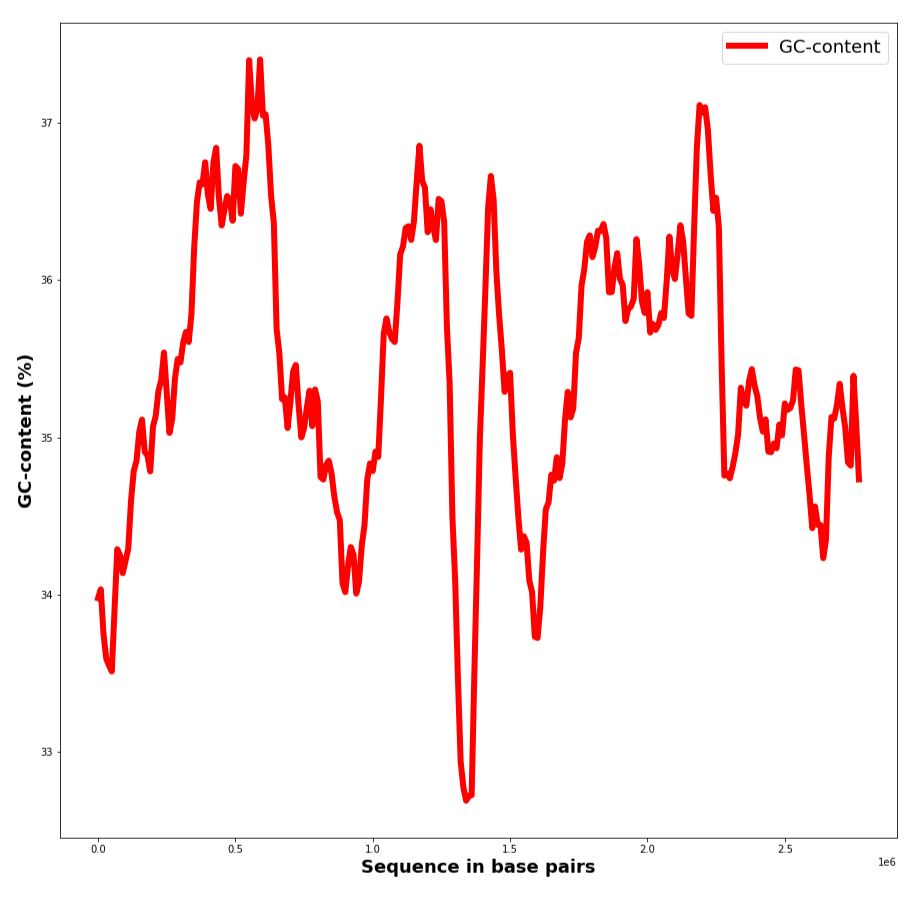
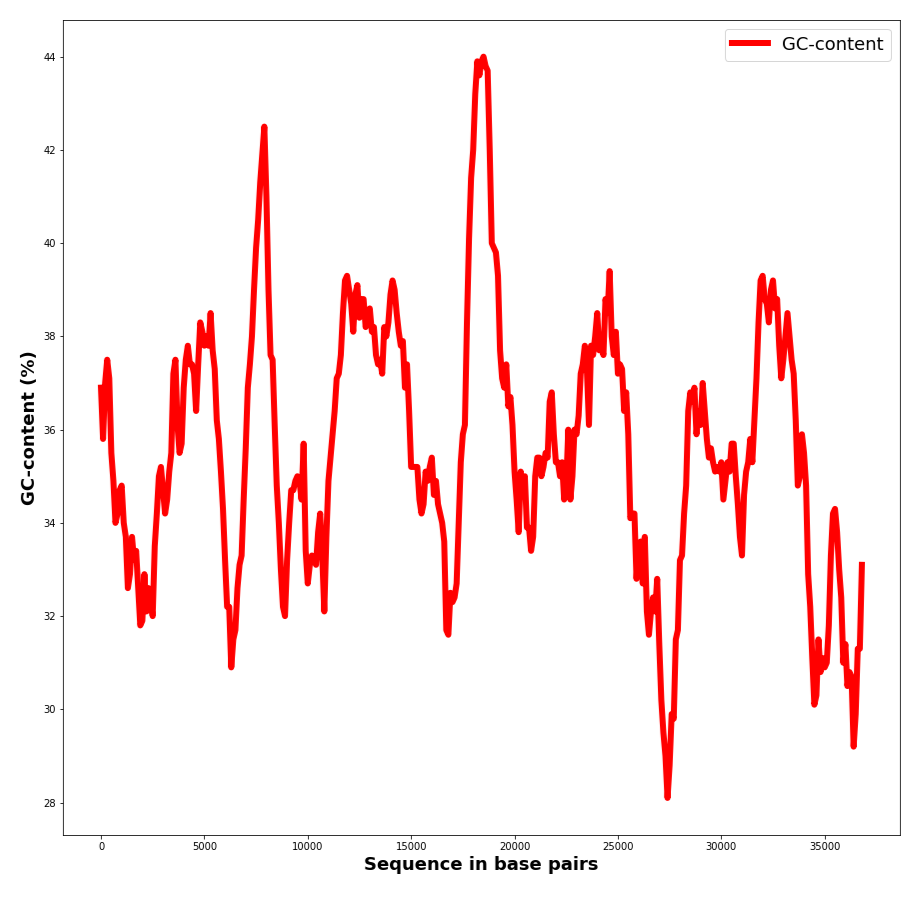
GC-content was then analyzed on DNA sections. The results are presented in Table 3, Figure 1 and plots S6. As can be seen from Figure 1 GC-content varies in a sufficient but not too large range and changes in a jumpy way from section to section. The maximum and minimum points were calculated and products coded in these regions were found using notebook S8, see Table 3 for results. The highest GC content for the chromosome is presented in an rRNA coding part of the DNA strand. It is also noticeable that GC-content in the chromosome is higher in a gene that has a definite product. In the plasmid GC-content is lower in a non-coding region of the DNA, than in the one responsible for protein coding.
| Type of information | Chromosome | Plasmid pB12E5 |
|---|---|---|
| Maximum GC-content | 63.00% | 44.00% |
| Approximate max location | 2268000 | 18500 |
| Product | rRNA | Hypothetical protein |
| Minimum GC-content | 23.70% | 28.10% |
| Approximate min location | 1403000 | 27400 |
| Product | Hypothetical protein | None |
3.3. Proteome study
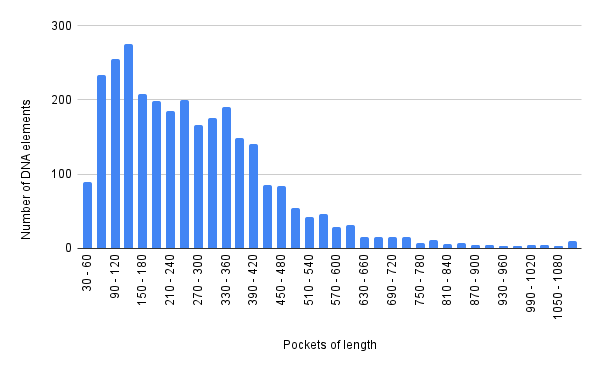
Saccharolobus shibatae B12 has 2968 unique Id protein coding gene features (feature counts table S4). By comparing this number with the genome size, we see that only a small part of the genome codes protein products. In size proteins vary but most often they are 200-250 amino acid residues long (AA), the unimodal peak is that of 120-150 AA in length (see Figure 2, sheet “Histogram” S9). The histograms show us that frequency of protein lengths fitting the respective pocket lengths falls with the growth of the size of the product. This can also be derived from analyzing the five longest gene products of S. shibatae, their lengths cover a significant range from 1240 to 1427 AA. According to statistical information presented in sheet “Statistics” S9, the average product length is indeed 278 AA, the median is 246.
| DNA strand | Chromosome | Plasimid pB12E5 |
|---|---|---|
| + | 1512 | 35 |
| - | 1401 | 30 |
| Statistical significance | 0.041523 | 0.590053 |
The number of proteins encoded in each of the DNA strands is presented in Table 4 (sheet “Randomness" S9),
low statistical significance assesses that there is little difference between the two DNA strands both
for the chromosome and plasmid. The statistical significance in the Plasmid pB12E5 is slightly larger due to
the small size of the DNA molecule itself. We can see that proteins are in equal measure encrypted in both strands.
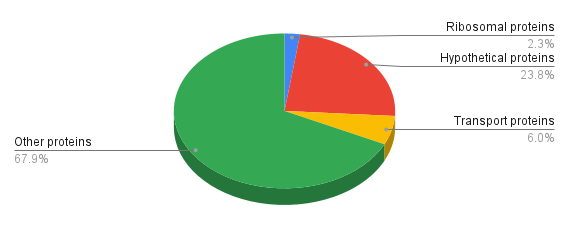
Proteins have different functions and different proteins are presented in various degrees, see figure 3 (table
of proteome analyses S10). We can see that the relative amounts of ribosomal and transport proteins are
not high, especially those of r-proteins.
RNA genes study
RNA genes were analyzed and the results are presented in table 5. It is noticeable that most of the RNA genes are transport ones. This correlates with the results of proteome analyses in the way that in both situations numbers of transport molecules are larger than those of ribosomal. Apart from tRNA and rRNA there are also non-coding RNA genes, functional RNA molecules that are not translated into proteins, and there is no mRNA as S. shibatae is a prokaryotic species.
| Type of RNA | Number | Percentage |
|---|---|---|
| Transfer | 46 | 90.1961 |
| Ribosomal | 3 | 5.8824 |
| ncRNA | 2 | 3.9216 |
| Total | 51 |
4. Discussion
The genome size of S.shibatae indicates that this archaea species is likely nor a parasite, nor does it live in
marine waters and also shows another reason why it may have previously been put in the genus Sulfolobus
(Nicholas et al., 2018).
DNA double helix with high GC-content has been shown to be more stable, namely such bacteria are thermostable
(Yakovchuk et al., 2006). But in this case GC-content is not that large which shows that maybe it is not
quite GC content of the entire genome that is in average higher in thermophilic species (Hurst et al., 2001), that
GC content does not correlate with optimal growth temperatures for archaea (Grogan, 2013).
The highest GC content for the chromosome presented in an rRNA coding part of the DNA may be explained
by the preferred habitat of S. shibatae, as there is believed to exist a striking correlation between the GC-content
of ribosomal RNA stems and the optimal growth temperature of an organism (Galtier et al., 1997). The
products relevant to the maximum and minimum GC-content genome sections may confirm the idea of relative
GC-content richness of highly expressed genes (Wuitschick et al., 1999).
The statistics numbers for product lengths are average numbers for studied archaea (Brocchieri et al., 2005).
The relative lowness or ribosomal and transport proteins might mean that for their successful functioning
and reproducing only a small number of genes is necessary. This has even been shown in the case of ribosomal
proteins, which might not appear to be essential when deleted (Gao et al., 2015).
It is possible that transport proteins are more varied and have to complete more differing functions therefore
their numbers are larger as well. Similarly, the results of tRNA genes research can probably be explained
by their function – they have to transport various substances and must be able to react appropriately with any
chemical they come across.
5. Conclusions
Genome and proteome of Saccharolobus shibatae B12 has been studied. It was shown that even the smallest details can give us information, such as genome sequence length. Study of GC-content has given us an insight into the variety of views on one issue that exist in the modern scientific world. Transport proteins and transfer RNA, as well as r-proteins and rRNA, have been found to relatively corelate in their numbers.
Supplementary Materials:
-
NCBI data about Saccharolobus shibatae B12 –
Index of /genomes/all/GCF/019/175/345/GCF_019175345.1_ASM1917534v1 - FASTA file for S. shibatae DNA from NCBI
- Feature table for S. shibatae genome from NCBI
- Table of feature counts for S. shibatae from NCBI
- Programs in Python
- Plots of GC-content distribution
- GenBank file for S. shibatae from NCBI
- Extracted lines from GenBank file
- Histogram of protein lengths and number of proteins on strands
- Table of proteome analysis
- Table of RNA analysis
- Table of gene distribution
Acknowledgements: I would like to thank our Practical Informatics teachers for introducing me and my groupmates to many of the used methods and resources.
References
- Grogan D, Palm P, Zillig W. Isolate B12, which harbours a virus-like element, represents a new species of the archaebacterial genus Sulfolobus, Sulfolobus shibatae, sp. nov. Arch Microbiol 1990; 154:594–599.
- Albers, SV., Siebers, B. (2014). The Family Sulfolobaceae . In: Rosenberg, E., DeLong, E.F., Lory, S., Stackebrandt, E., Thompson, F. (eds) The Prokaryotes. Springer, Berlin, Heidelberg.
- Sakai HD, Kurosawa N. Saccharolobus caldissimus gen. nov., sp. nov., a facultatively anaerobic iron-reducing hyperthermophilic archaeon isolated from an acidic terrestrial hot spring, and reclassification of Sulfolobus solfataricus as Saccharolobus solfataricus comb. nov. and Sulfolobus shibatae as Saccharolobus shibatae comb. nov. Int J Syst Evol Microbiol 2018; 68:(4)1271–1278.
- Jaxel C, Bouthier-de-la-Tour C, Duguet M and Nadal M (1996). "Reverse gyrase gene from Sulfolobus shibatae B12: gene structure, transcription unit and comparative sequence analysis of the two domains". Nucleic Acids Research 24(23):4668-75. doi:10.1093/nar/24.23.4668.
- Yakovchuk P, Protozanova E, Frank-Kamenetskii MD (2006). "Base-stacking and base-pairing contributions into thermal stability of the DNA double helix". Nucleic Acids Res. 34 (2): 564–74. doi:10.1093/nar/gkj454
- Galtier, N., Lobry, J. Relationships Between Genomic G+C Content, RNA Secondary Structures, and Optimal Growth Temperature in Prokaryotes. J Mol Evol 44, 632–636 (1997). https://doi.org/10.1007/PL00006186
- D.W. Grogan. Brenner's Encyclopedia of Genetics (Second Edition), 2013
- Hurst L.D., Merchant A.R. High guanine-cytosine content is not an adaptation to high temperature: a comparative analysis amongst prokaryotes. Proc Biol Sci. 2001 Mar 7; 268(1466): 493–497. doi: 10.1098/rspb.2000.1397.
- Wuitschick JD, Karrer KM (1999). "Analysis of genomic G + C content, codon usage, initiator codon context and translation termination sites in Tetrahymena thermophila". J. Eukaryot. Microbiol. 46 (3): 239–47. doi:10.1111/j.1550-7408.1999.tb05120.x
- Nicholas P. Robinson, Siri Kellner, Anja Spang, Pierre Offre, Gergely J. Szöllősi, Celine Petitjean, Tom A. Williams; Genome size evolution in the Archaea. Emerg Top Life Sci 14 December 2018; 2 (4): 595–605. https://doi.org/10.1042/ETLS20180021
- Brocchieri L, Karlin S. Protein length in eukaryotic and prokaryotic proteomes. Nucleic Acids Res. 2005 Jun 10; 33(10):3390-400. PMID: 15951512; PMCID: PMC1150220. doi: 10.1093/nar/gki615.
- Gao F, Luo H, Zhang CT, Zhang R (2015). "Gene essentiality analysis based on DEG 10, an updated database of essential tial genes". Gene Essentiality. Methods in Molecular Biology. Vol. 1279. pp. 219–33. doi:10.1007/978-1-4939-2398-4_14