The model consists of two molecules on an interval [0,30] (angstroms) with 3 and 2 atoms respectively. The coordinates of atom centers are 11, 12, 13, 17, 18; the heights of their peaks are 20, 30, 10, 15, 25.
The model's electron density plot (Fig. 1) was constructed using compile-func.py with parameters: -g 20,3,11+30,3,12+10,3,13+15,3,17+25,3,18.
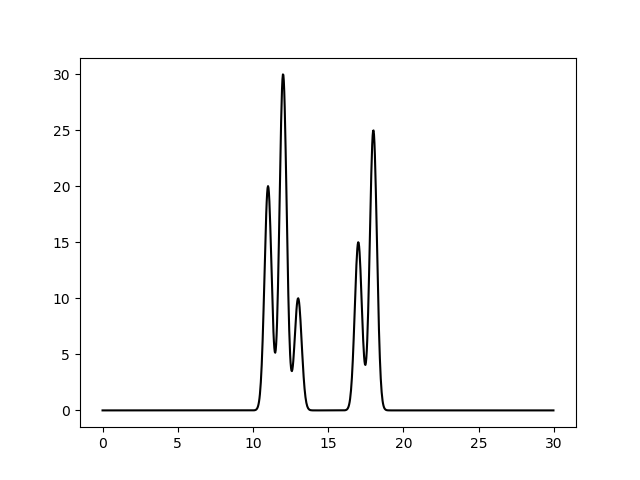
Figure 1. The model's electron densety plot.
Figure 2 demonstrates reconstructed electron density plots using 10, 20, 25 and 30 harmonics. With 10 or 20 only molecules are distinguishable; with 25 all atoms are distinguishable, but their coordinates are not accurate; and finally, when using 30 harmonics coordinates of all the atoms can be reconstructed accurately. Thus, n_0 = 30.
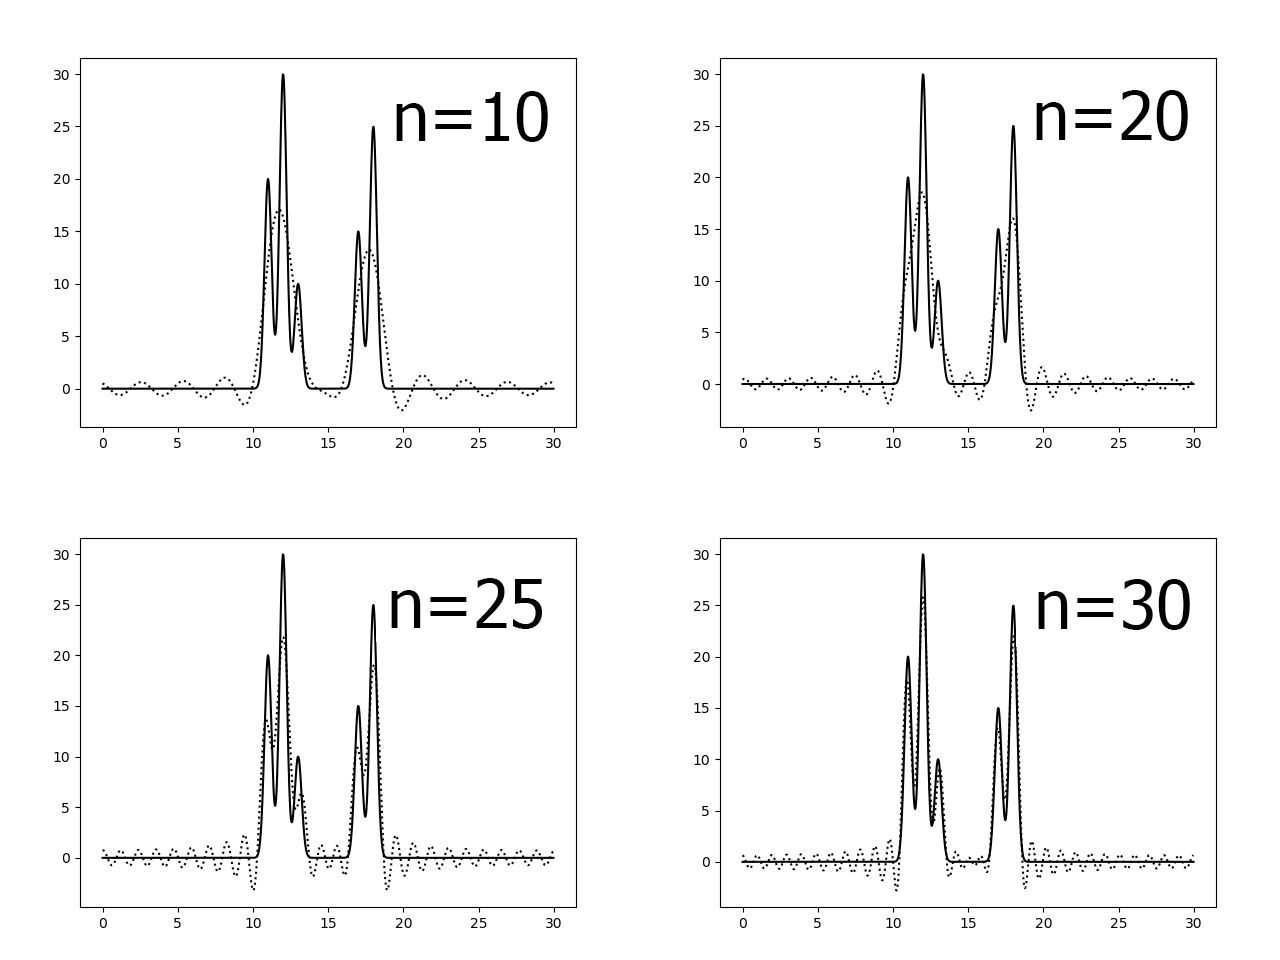
Figure 2. Model's reconstrution from n harmonics.
As seen on the Figure 3, amplitude noise expectedly didn't change the shape of the reconstructed function much while phase noise did change it quite drastically. Also, applying both noises simultaneously further increased the distortion.
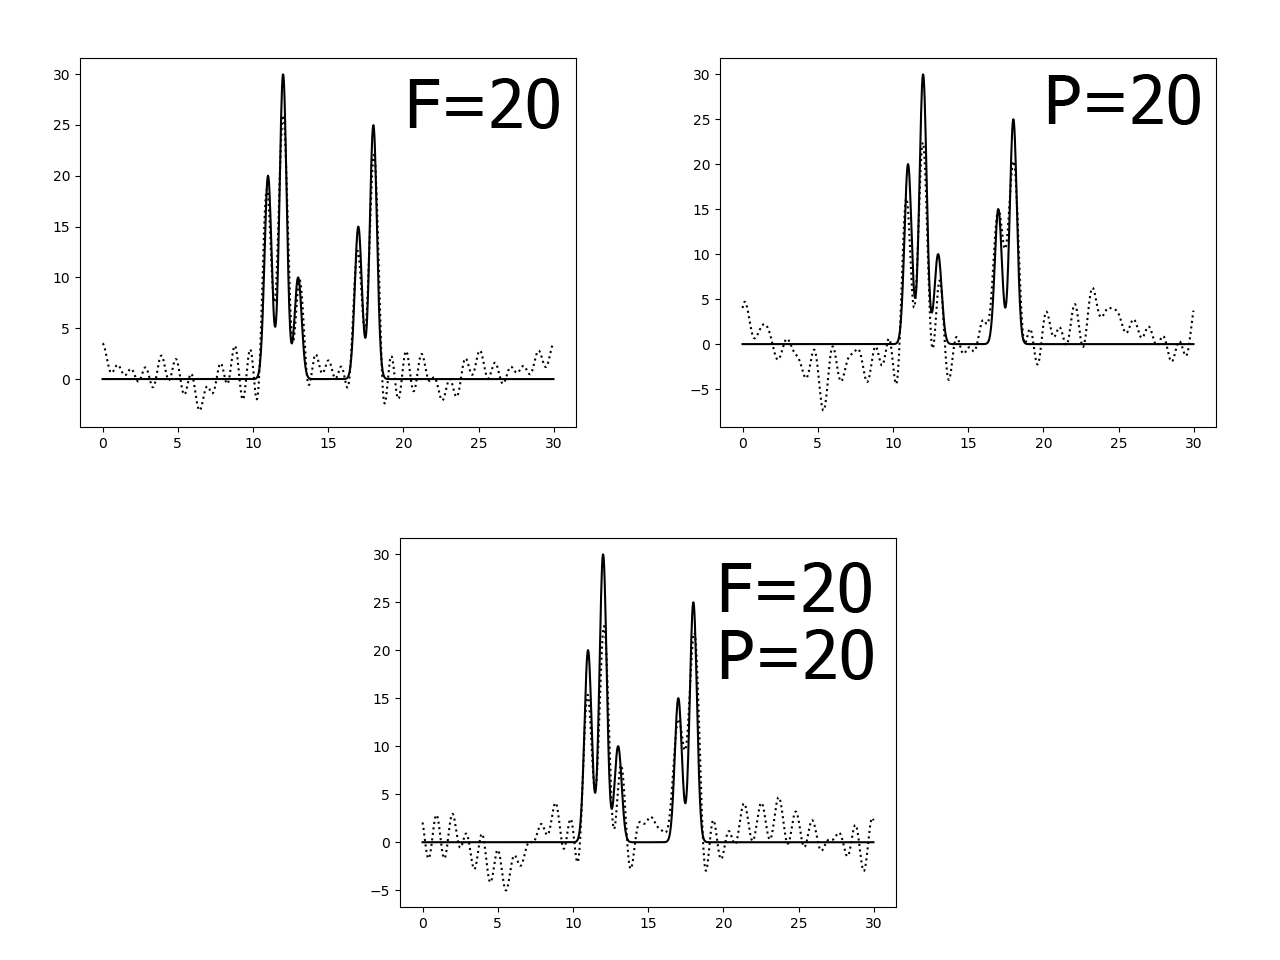
Figure 3. Model's reconstrution from 0-30 harmonics with noise.
Deleting first two harmonics changed the overall shape of the plot quite much, but didn't affect the details while deleting three harmonics from the midlle (14-16) slightly distorted the details and had no effect on the overall shape (Fig. 4). Adding the 40th harmonics didn't really change anything.
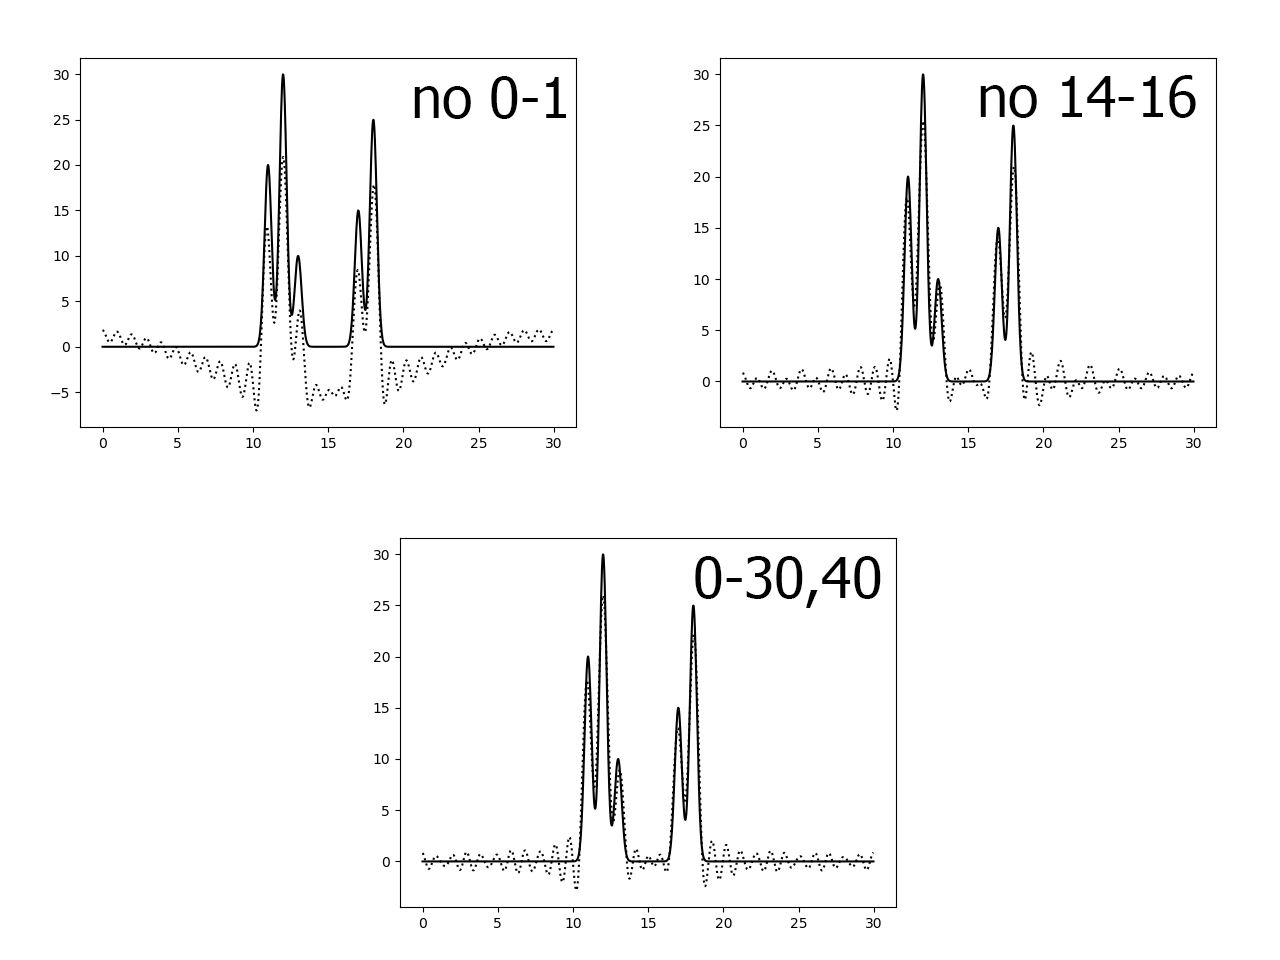
Figure 4. Model's reconstrution from incomplete sets of harmonics.
The quality of reconstruction can be: bad -- only the approximate size of a molecule can be determined; medium -- coordinates of some atoms can be determined; good -- coordinates of all atoms can be determined with the knowledge of their number; perfect -- coordinates of all atoms can be precisely determined without any beforehand knowledge. Resolution of a set was considered to be the least resolution of a harmonic in a set if more than 90% of harmonis with higher resolution were also measured.
Table 1. Reconstruction of electron density function from fourier coefficients.
| Harmonics set | Resolution (Å) | Completness of set (%) | Amplitude noise (%) | Phase noise (%) | Reconstruction quality (perfect, good, medium, bad) |
|---|---|---|---|---|---|
| Complete harmonics sets | |||||
| 0-10 | 3 | 100 | 0 | 0 | Bad |
| 0-20 | 1.5 | 100 | 0 | 0 | Medium |
| 0-25 | 1.2 | 100 | 0 | 0 | Good |
| 0-30 | 1 | 100 | 0 | 0 | Perfect |
| 0-30 | 1 | 100 | 20 | 0 | Perfect |
| 0-30 | 1 | 100 | 0 | 20 | Medium |
| 0-30 | 1 | 100 | 20 | 20 | Medium |
| Incomplete harmonis sets | |||||
| 2-30 | 1 | 93 | 0 | 0 | Good |
| 0-13,17-30 | 1 | 90 | 0 | 0 | Perfect |
| 0-30,40 | 1 | 100 | 0 | 0 | Perfect |