Alignments
Differences between alignments of the same sequences
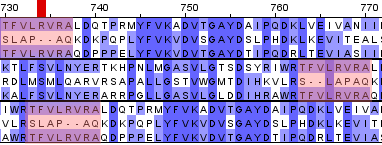
Here we can see, that in ClustalO alignment (first line) and in Tcoffee alignment (last line) LEU(649) from Oryzias latipes
is aligned with PHE(683) from Rattus norvegicus and PHE(693) from Homo sapiens. In Mafft (middle line)alignment the same leucine is aligned with LEU(685) from Rattus norvegicus
and LEU(695) from Homo sapiens. Analyzed blocks are marked with red.
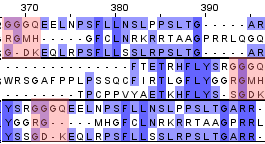
Here we can see, that in ClustalO alignment and in Tcoffee alignment ARG(324) from Oryzias latipes
is aligned with GLY(340) from Rattus norvegicus and GLY(336) from Homo sapiens. In Mafft alignment the same arginine is aligned with GLY(340) from Rattus norvegicus
and SER(335) from Homo sapiens. GLY(336) from Homo sapiens is aligned with GLY(325) from Oryzias latipes and GLY(341) from Rattus norvegicus Analyzed blocks are marked with red.
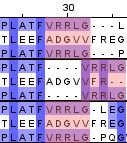
Here we can see the first block, where ClustalO alignment and Tcoffee alignment are different from Mafft alignment. In Mafft alignment ALA(27),
ASP(28), GLY(29) and VAL(30) from Oryzias latipes are not aligned with anything (=aligned with gaps), while in other 2 alignments they are aligned with other aminoacids.
ClustalO and Tcoffee alignments look quite similar and, i think, both are usefull. Mafft alignment is much longer than the others and that looks suspicious o_O.
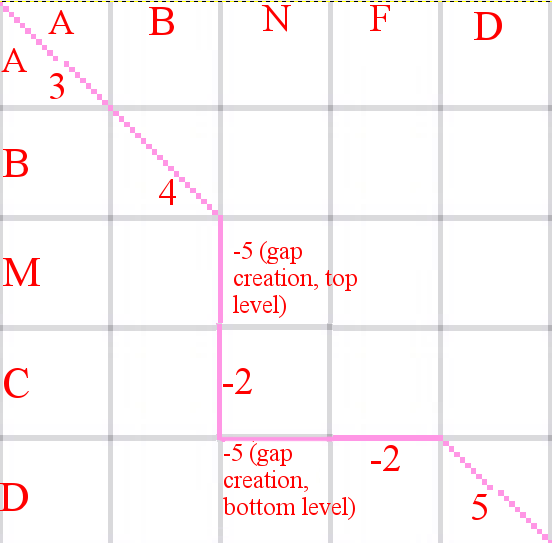
Description of a graph for global alignment with affine gap penalties
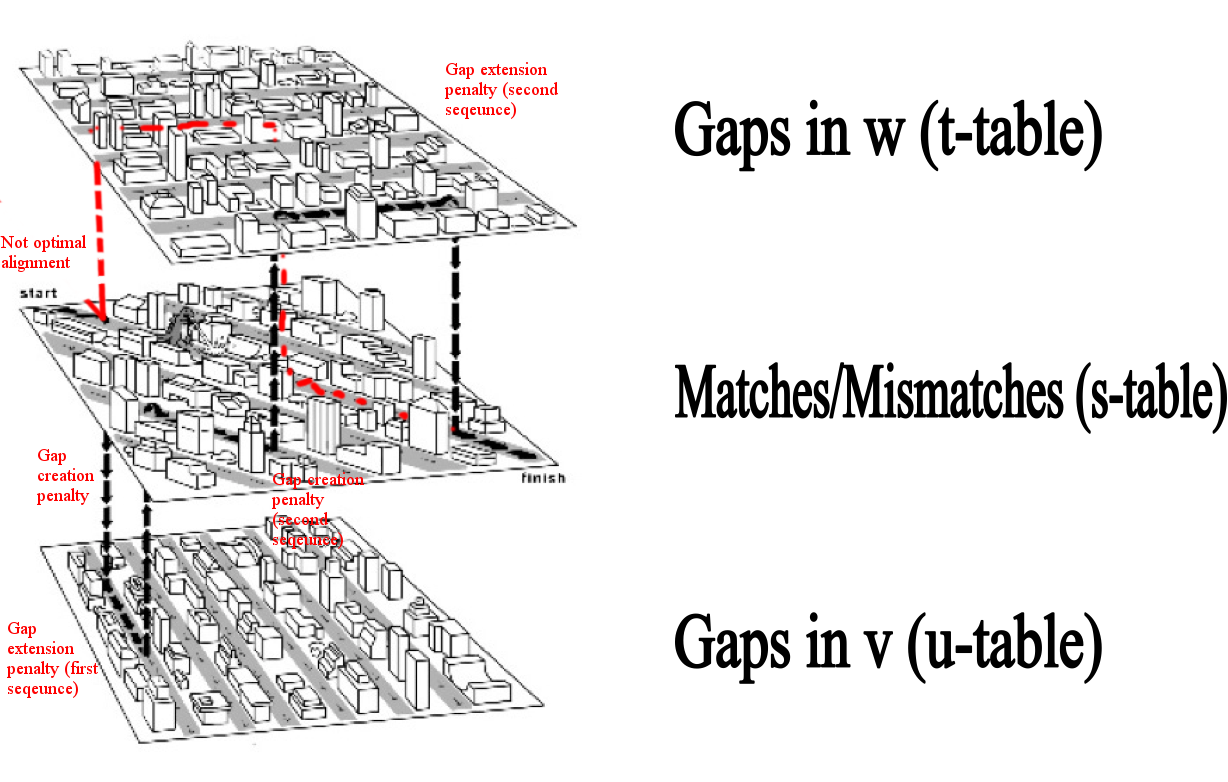
"Manhattan" scheme.
Here we can see a Manhattan scheme for optimal(black) and not optimal (red) alignments. Affine gap penalties mean exactly that we have 2 different penalties - gap creation penalty
and gap extension penalty. While gap creates in one of the sequences, we "migrate" on one level up (for the first sequence) or down (for the second sequence). Each "step" on that new
level means a gap extension penalty. On the middle level, each step means the comparison of 2 aminoacids. In optimal alignments, gap penalties are the least (in absolute magnitude),
while scores for aminoacids comparison are the biggest. For suboptimal alignments (red) gap penalties are bigger and scores for aminoacids are lower. Main scheme is presented below.
Description of a graph for local alignment with linear gap penalties
For a linear penalties gap creation penalty equal to gap extension penalty. Local alignment means that alignment map could contain different aminoacids or gaps in corners, and sequences\
are aligned particularly.
Friendliness matrix
Posiiton of viewers.
| Total number of males |
Total number of females |
Total number |
Total number of pairs |
Qm |
Qf |
| 46 |
42 |
88 |
80 |
0,5227 |
0,4773 |
| Qm*Qm*80 |
Qf*Qf*80 |
Qf*Qm*80 |
Qm*Qf*80 |
Number of MM pairs |
Number of FF pairs |
Number of MF pairs |
Number of FM pairs |
| 21,85 |
18,22 |
19,95 |
19,95 |
24 |
20 |
18 |
18 |
| Pmm |
Pff |
Pfm |
Pmf |
Average of Pmf and Pfm |
{100*log2Lmm} |
{100*log2Lff} |
{100*log2Lfm} |
{100*log2Lmf} |
| 0,3 |
0,25 |
0,225 |
0,225 |
0,225 |
14 |
14 |
-15 |
-15 |
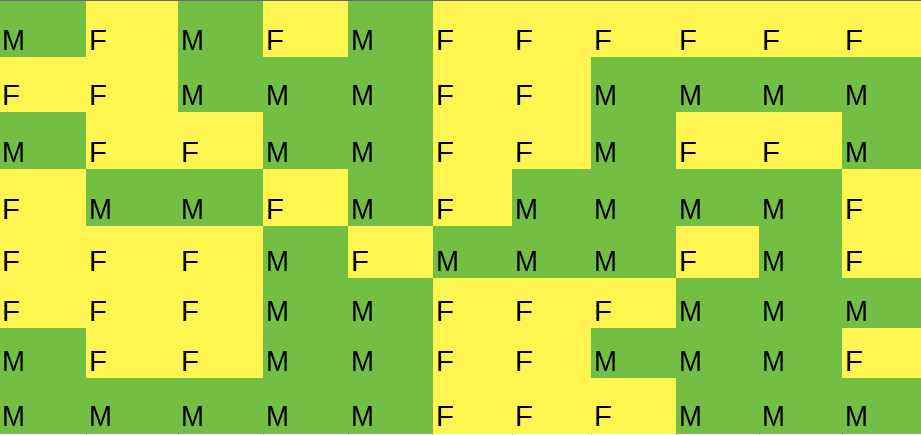
Final matrix
Comments
At first, numbers in each cell may be not the same. But here we can see that women prefer to sit near women, and men - near men.
© Gumerov Ruslan, 2017