MAIN
TERMS
PROJECTS
ABOUT
Preparation of reads
Command table
| Command name | Command function |
| fastqc chr10.fastq | read quality control |
| java -jar /nfs/srv/databases/ngs/suvorova/trimmomatic/trimmomatic-0.30.jar SE -phred33 chr10.fastq chr10_out.fastq TRAILING:20 MINLEN:50 | trimming reads with set-up parameters |
| fastqc chr10_out.fastq | read quality control |
Read quality analysis
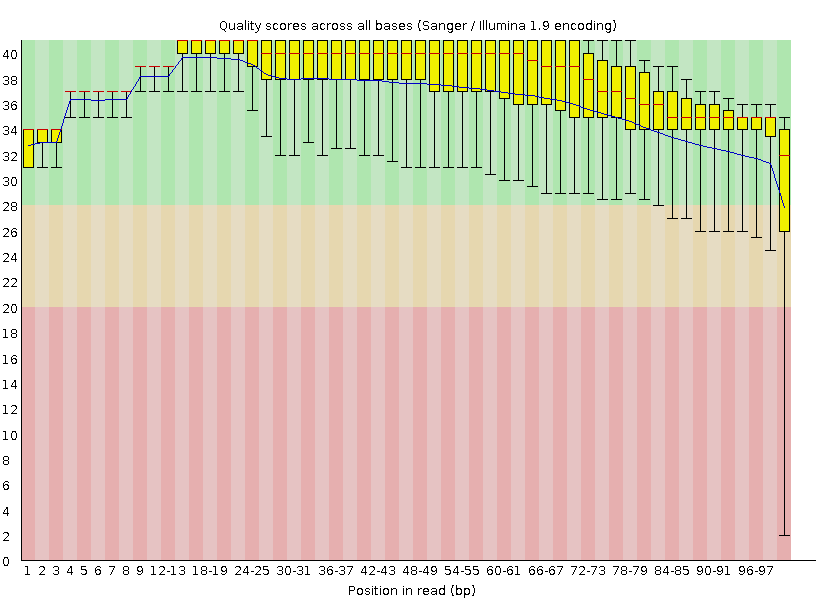
Per base quality chart before trimming
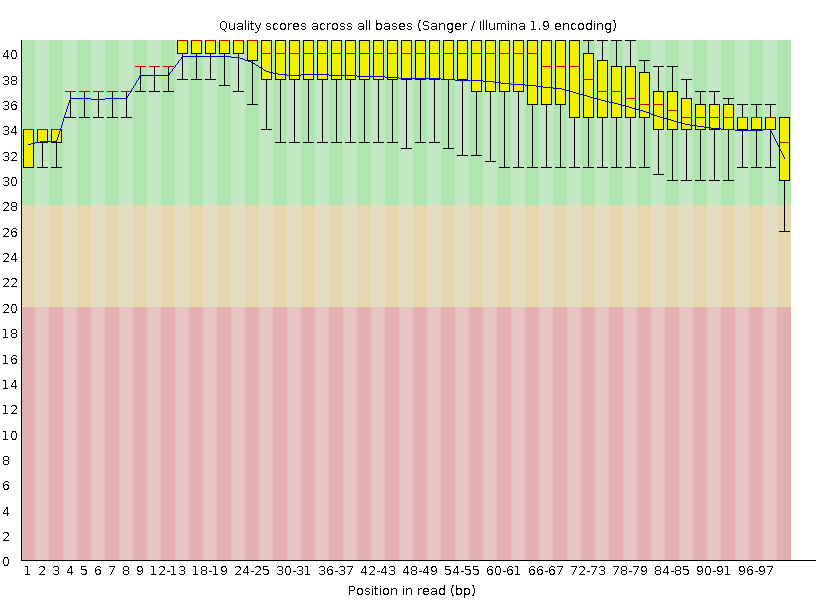
Per base quality chart after trimming
Number of reads before trimming: 10666
Number of reads after trimming: 10526
After trimming reads with low quality, we can see, that terminating parts with bad quality are cropped, and that fact change the distribution of the last bar chart. Also, sequence length distribution changes after trimming, because reads with length fewer than 50 have been trimmed.
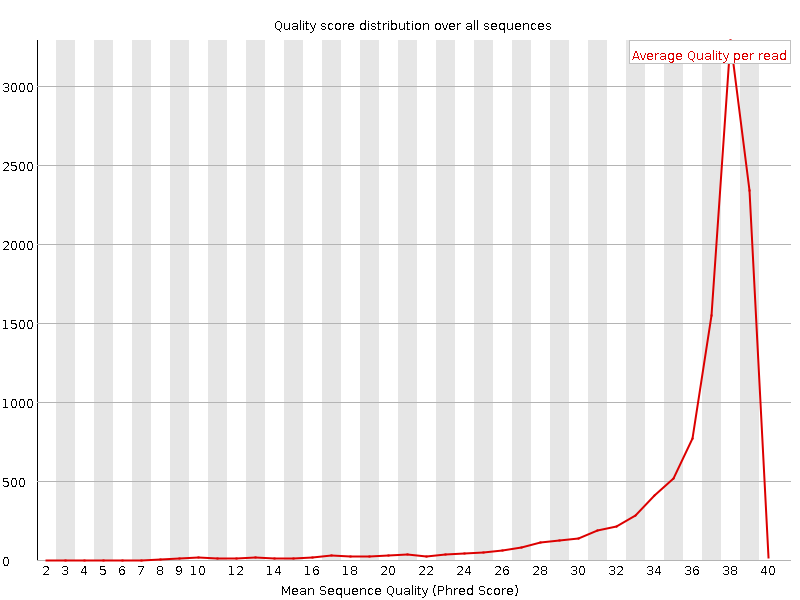
Per sequence quality scores
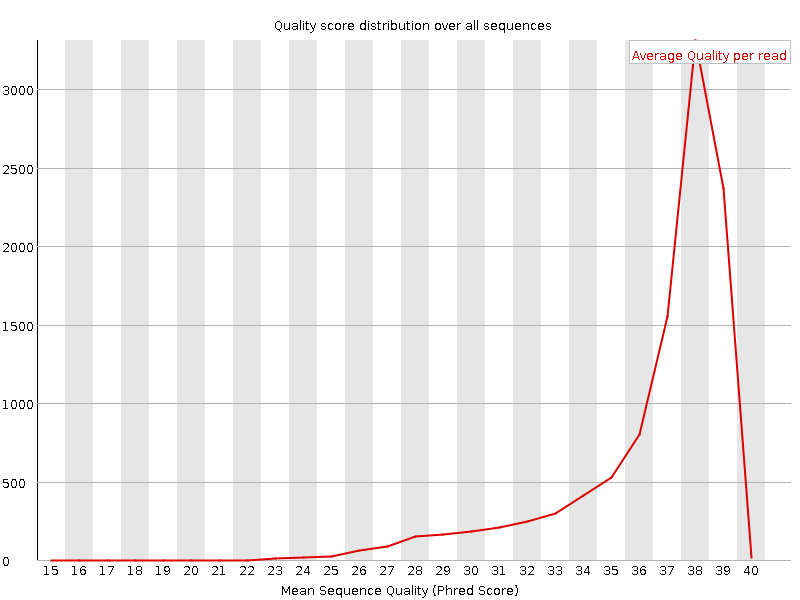
Per sequence quality scores after trimming
Here we can see, that distribution of quality scores have been changed after trimming. That makes sense because we have directly changed the quality scores during trimming.
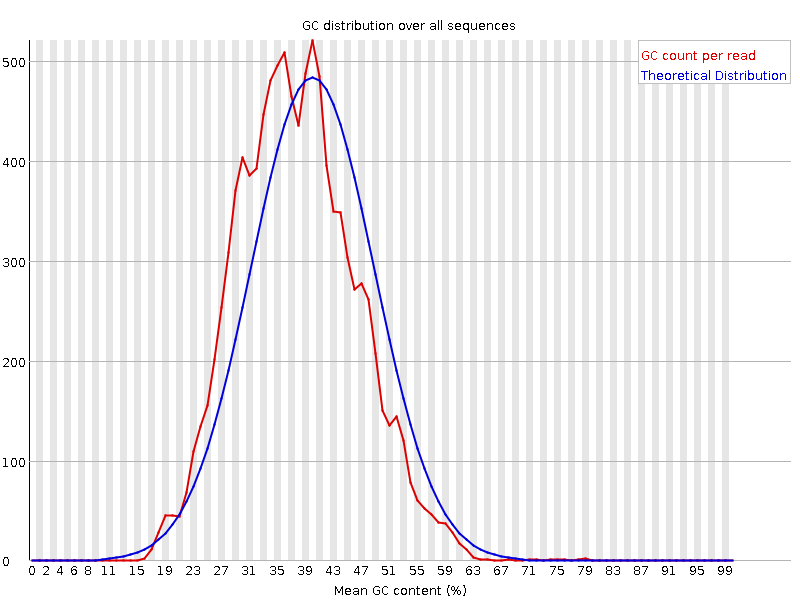
GC content
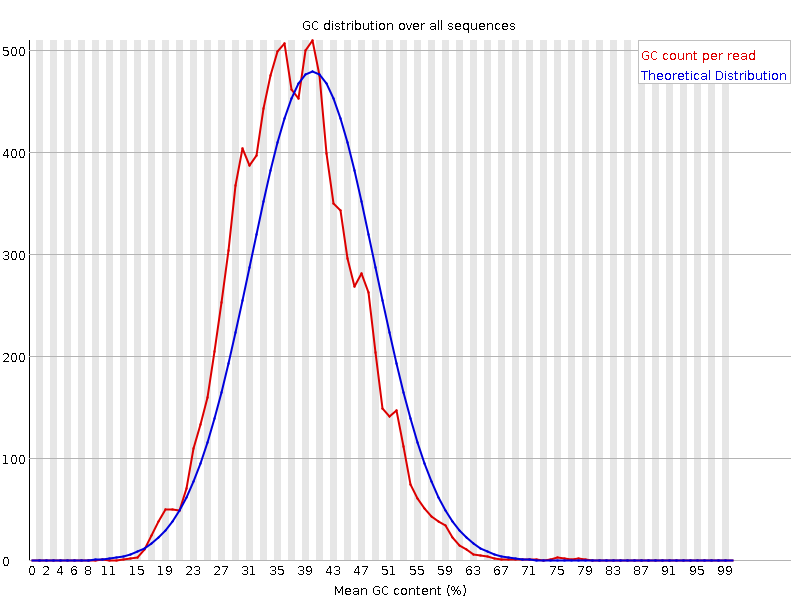
GC content after trimming
Here we can see, that GC content didn't change significantly after trimming. However, GC content is necessary for estimation of sequencing quality, and it's not normal if the distribution of per sequence GC is not Gaussian (doi:10.1093/nar/gks001).
Mapping
| Command name | Command function |
| /home/students/y06/anastaisha_w/hisat2-2.0.5/hisat2-build chr10.fasta chr10 | reference indexing |
| /home/students/y06/anastaisha_w/hisat2-2.0.5/hisat2 -x chr10 -U chr10_out.fastq --no-spliced-alignment --no-softclip > chr10.sam | creating the alignment in .sam extension |
| samtools view chr10.sam -b > chr10.bam | converting the alignment to .bam extension |
| samtools sort chr10.bam -T temp.txt -o chr10_sorted.bam | sotring the .bam file |
| samtools index chr10_sorted.bam | indexing sorted .bam file |
| samtools depth -r chr10:115438921-115490668 chr10_sorted.bam > exon.lalala | getting the coverage depth |
Alignment result
10526 reads; of these:
  10526 (100.00%) were unpaired; of these:
    131 (1.24%) aligned 0 times
    10393 (98.74%) aligned exactly 1 time
    2 (0.02%) aligned >1 times
98.76% overall alignment rate
Here we can see, that 131 reads didn't map on the chromosome, 10395 reads were map.
Average exon coverage
For extra-task i chose the Homo Sapiens caspase 7, apoptosis-related cysteine peptidase (CASP7) exon with coordinates chr10:115438921-115490668. The result is presented below, average coverage was about 13 nucleotides per read.
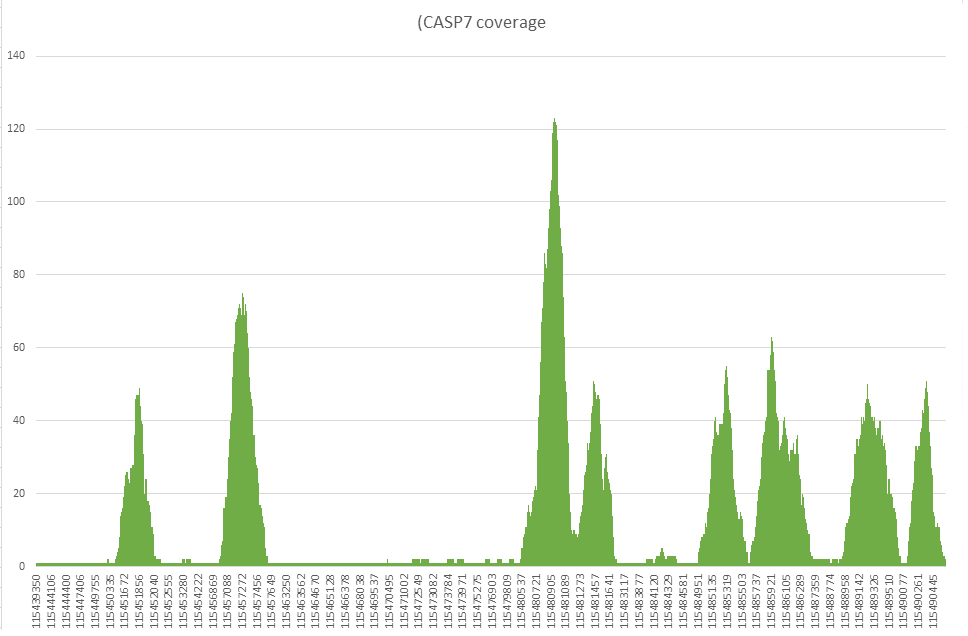
Coverage plot
SNP and indel searching
| Command name | Command function |
| samtools mpileup -uf chr10.fasta chr10_sorted.bam -o chr10.bcf | creating the .bcf file |
| bcftools call -cv chr10.bcf -O v -o chr10.vcf | converting .bcf file to .vcf file |
| Coordinates | Polymorphism type | Reference and reads comparison | Coverage depth | Reads quality |
| chr10:5757984 | Transition | A->G | 1 | 11.34 |
| chr10:63955361 | Insertion | ggaatgaa->gGAATgaatgaa | 1 | 22.49 |
| chr10:5804633 | Deletion | TTC->TTCTC | 119 | 217.47 |
SNP annotation
| Command name | Command function |
| convert2annovar.pl -format vcf chr10.vcf > chr10.avinput | creating the .avinput file |
| annotate_variation.pl -filter -out chr10_138 -build hg19 -dbtype snp138 chr10.avinput /nfs/srv/databases/annovar/humandb.old/ | checking the prescence of the SNP in the dbsnp |
| annotate_variation.pl -out refgene -build hg19 chr10.avinput /nfs/srv/databases/annovar/humandb.old | checking the prescence of the SNP in the RefGene |
| annotate_variation.pl -filter -out 1000g -build hg19 -dbtype 1000g2014oct_all chr10.avinput /nfs/srv/databases/annovar/humandb.old/ | checking the prescence and counting the frequencies of snp's in 1000genome database |
| annotate_variation.pl -regionanno -out gwas -build hg19 -dbtype gwasCatalog chr10.avinput /nfs/srv/databases/annovar/humandb.old/ | checking the associations with phenotypes |
| annotate_variation.pl -filter -out clinvar -build hg19 -dbtype clinvar_20150629 chr10.avinput /nfs/srv/databases/annovar/humandb.old/ | checking the associations between medically important variants and phenotypes |