Таксономическое положение получено с
сервиса NCBI.
Все бактерии имеют общую таксономию cellular organisms; Bacteria; Terrabacteria group; Firmicutes; Bacilli
до уровня класса включительно. Более наглядно их систематическое положение отражено на дереве.
Если установить программу MEGA, а потом 2 раза щёлкнуть на файл 4-1.tre, открывается изображение дерева.
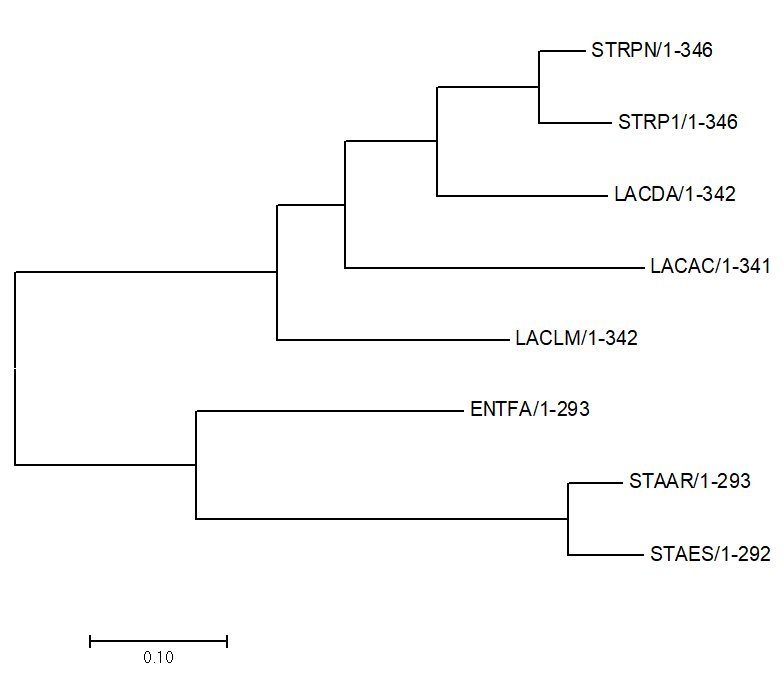
Рисунок 1.
Филогенетическое дерево, построенное программой MEGA 7.0 (Older version)
Нетривиальные ветви дерева
Мы называем ветвь нетривиальной, если она разбивает множество листьев на подмножества, в каждом из которых более одного элемента.
Есть 4 нетривиальных разбиения этого дерева:
{STRP1, STRPN} против {LACLM, LACAC, LACDA, ENTFA, STAAR, STAES}
{STRP1, STRPN, LACLM} против {LACAC, LACDA, ENTFA, STAAR, STAES}
{STRP1, STRPN, LACLM, LACAC, LACDA} против {ENTFA, STAAR, STAES}
{STRP1, STRPN, LACLM, LACAC, LACDA, ENTFA} против {STAAR, STAES}
По инструкции на kodomo:
"Запустите JalView. В меню File выберите Fetch sequences. Щёлкните по "Select Database" и выберите Uniprot.
Запишите через точку с запятой идентификаторы белков — выражения вида xxxx_yyyyy, где xxxx –
выбранная вами мнемоника функции, а yyyyy – мнемоники отобранных вами организмов (в нашем случае
efts_strp1; efts_strpn; efts_laclm; efts_lacac; efts_lacda; efts_entfa; efts_staar; efts_staes; ).
После нажатия OK должно появиться окно с последовательностями.
В этом окне выберите Web Service → Alignment → любая программа (например Muscle)".
Было получено выравнивание,
сохранённое в формате fasta. Далее в Jalview были изменены названия и оставлены только мнемоники видов, название белка из описания тоже удалено,
выравнивание сохранено в
файле снова в формате fasta.
Файл с выравниванием был открыт программой MEGA (File -> Open, согласиться на Analyze и выделить строчку белков), далее разными способами построены деревья (Analysis -> Phylogeny -> ...).
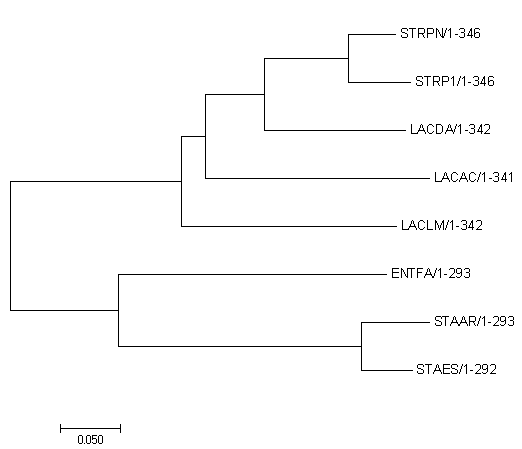
Рисунок 2.
Molecular Phylogenetic analysis by Maximum Likelihood method .nwk
The evolutionary history was inferred by using the Maximum Likelihood method based on the JTT matrix-based model [1]. The tree with the highest log likelihood (-2892.52) is shown. Initial tree(s) for the heuristic search were obtained automatically by applying Neighbor-Join and BioNJ algorithms to a matrix of pairwise distances estimated using a JTT model, and then selecting the topology with superior log likelihood value. The tree is drawn to scale, with branch lengths measured in the number of substitutions per site. The analysis involved 8 amino acid sequences. All positions containing gaps and missing data were eliminated. There were a total of 289 positions in the final dataset. Evolutionary analyses were conducted in MEGA7 [2].
1. Jones D.T., Taylor W.R., and Thornton J.M. (1992). The rapid generation of mutation data matrices from protein sequences. Computer Applications in the Biosciences 8: 275-282.
2. Kumar S., Stecher G., and Tamura K. (2016). MEGA7: Molecular Evolutionary Genetics Analysis version 7.0 for bigger datasets.Molecular Biology and Evolution 33:1870-1874.
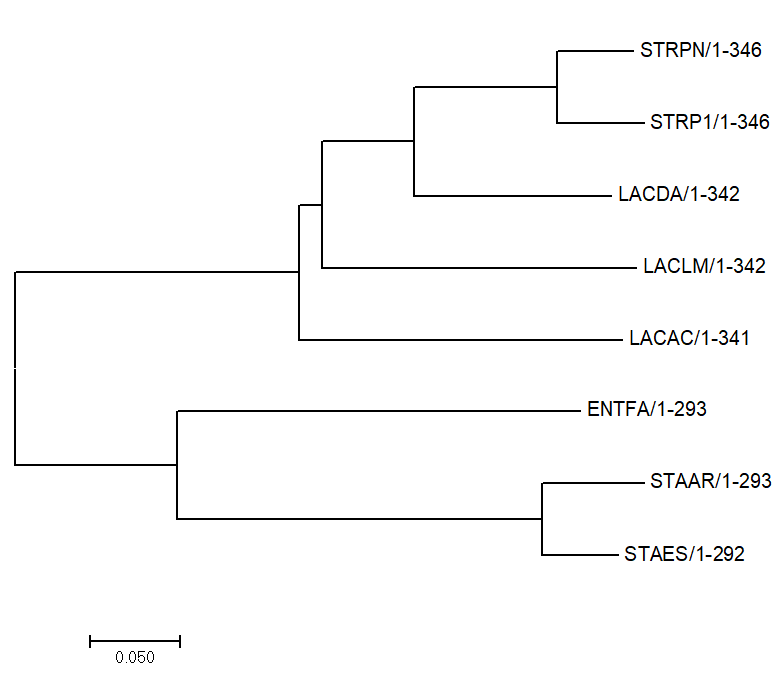
Рисунок 3.
Evolutionary relationships of taxa .nwk
The evolutionary history was inferred using the Neighbor-Joining method [1]. The optimal tree with the sum of branch length = 1.46595275 is shown. The tree is drawn to scale, with branch lengths in the same units as those of the evolutionary distances used to infer the phylogenetic tree. The evolutionary distances were computed using the Poisson correction method [2] and are in the units of the number of amino acid substitutions per site. The analysis involved 8 amino acid sequences. All positions containing gaps and missing data were eliminated. There were a total of 289 positions in the final dataset. Evolutionary analyses were conducted in MEGA7 [3].
1. Saitou N. and Nei M. (1987). The neighbor-joining method: A new method for reconstructing phylogenetic trees. Molecular Biology and Evolution 4:406-425.
2. Zuckerkandl E. and Pauling L. (1965). Evolutionary divergence and convergence in proteins. Edited in Evolving Genes and Proteins by V. Bryson and H.J. Vogel, pp. 97-166. Academic Press, New York.
3. Kumar S., Stecher G., and Tamura K. (2016). MEGA7: Molecular Evolutionary Genetics Analysis version 7.0 for bigger datasets.Molecular Biology and Evolution 33:1870-1874.
Рисунок 4.
Evolutionary relationships of taxa .nwk
The evolutionary history was inferred using the Minimum Evolution method [1]. The optimal tree with the sum of branch length = 1.46372440 is shown. The tree is drawn to scale, with branch lengths in the same units as those of the evolutionary distances used to infer the phylogenetic tree. The evolutionary distances were computed using the Poisson correction method [2] and are in the units of the number of amino acid substitutions per site. The ME tree was searched using the Close-Neighbor-Interchange (CNI) algorithm [3] at a search level of 1. The Neighbor-joining algorithm [4] was used to generate the initial tree. The analysis involved 8 amino acid sequences. All positions containing gaps and missing data were eliminated. There were a total of 289 positions in the final dataset. Evolutionary analyses were conducted in MEGA7 [5].
1. Rzhetsky A. and Nei M. (1992). A simple method for estimating and testing minimum evolution trees. Molecular Biology and Evolution 9:945-967.
2. Zuckerkandl E. and Pauling L. (1965). Evolutionary divergence and convergence in proteins. Edited in Evolving Genes and Proteins by V. Bryson and H.J. Vogel, pp. 97-166. Academic Press, New York.
3. Nei M. and Kumar S. (2000). Molecular Evolution and Phylogenetics. Oxford University Press, New York.
4. Saitou N. and Nei M. (1987). The neighbor-joining method: A new method for reconstructing phylogenetic trees. Molecular Biology and Evolution 4:406-425.
5. Kumar S., Stecher G., and Tamura K. (2016). MEGA7: Molecular Evolutionary Genetics Analysis version 7.0 for bigger datasets.Molecular Biology and Evolution 33:1870-1874.
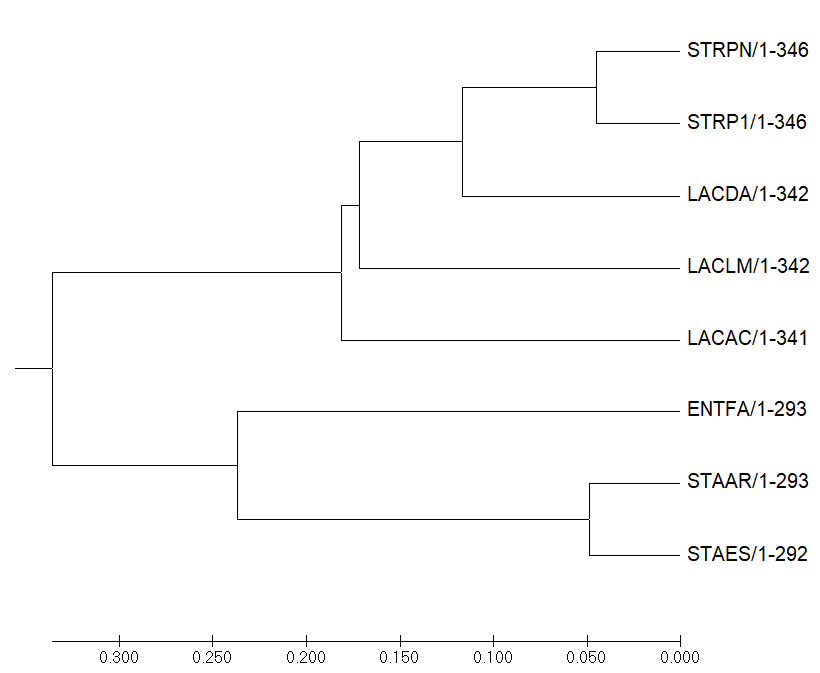
Рисунок 5.
Evolutionary relationships of taxa .nwk
The evolutionary history was inferred using the UPGMA method [1]. The optimal tree with the sum of branch length = 1.47135863 is shown. The tree is drawn to scale, with branch lengths in the same units as those of the evolutionary distances used to infer the phylogenetic tree. The evolutionary distances were computed using the Poisson correction method [2] and are in the units of the number of amino acid substitutions per site. The analysis involved 8 amino acid sequences. All positions containing gaps and missing data were eliminated. There were a total of 289 positions in the final dataset. Evolutionary analyses were conducted in MEGA7 [3].
1. Sneath P.H.A. and Sokal R.R. (1973). Numerical Taxonomy. Freeman, San Francisco.
2. Zuckerkandl E. and Pauling L. (1965). Evolutionary divergence and convergence in proteins. Edited in Evolving Genes and Proteins by V. Bryson and H.J. Vogel, pp. 97-166. Academic Press, New York.
3. Kumar S., Stecher G., and Tamura K. (2016). MEGA7: Molecular Evolutionary Genetics Analysis version 7.0 for bigger datasets.Molecular Biology and Evolution 33:1870-1874.
Рисунок 6.
Maximum Parsimony analysis of taxa .nwk
The evolutionary history was inferred using the Maximum Parsimony method. The most parsimonious tree with length = 414 is shown. The consistency index is 0.859903 (0.828909), the retention index is 0.767068 (0.767068), and the composite index is 0.659605 (0.635829) for all sites and parsimony-informative sites (in parentheses). The MP tree was obtained using the Subtree-Pruning-Regrafting (SPR) algorithm (pg. 126 in ref. [1]) with search level 0 in which the initial trees were obtained by the random addition of sequences (10 replicates). The analysis involved 8 amino acid sequences. All positions containing gaps and missing data were eliminated. There were a total of 289 positions in the final dataset. Evolutionary analyses were conducted in MEGA7 [2].
1. Nei M. and Kumar S. (2000). Molecular Evolution and Phylogenetics. Oxford University Press, New York.
2. Kumar S., Stecher G., and Tamura K. (2016). MEGA7: Molecular Evolutionary Genetics Analysis version 7.0 for bigger datasets.Molecular Biology and Evolution 33:1870-1874.
Укоренение с использованием внешней группы
По инструкции на kodomo:
"Запустите JalView. В меню File выберите Fetch sequences. Щёлкните по "Select Database" и выберите Uniprot.
Запишите через точку с запятой идентификаторы белков — выражения вида xxxx_yyyyy, где xxxx –
выбранная вами мнемоника функции, а yyyyy – мнемоники отобранных вами организмов (в нашем случае
efts_strp1; efts_strpn; efts_laclm; efts_lacac; efts_lacda; efts_entfa; efts_staar; efts_staes; efts_ecoli;).
После нажатия OK должно появиться окно с последовательностями.
В этом окне выберите Web Service → Alignment → любая программа (например Muscle)".
Было получено выравнивание,
сохранённое в формате fasta. Далее в Jalview были изменены названия и оставлены только мнемоники видов, название белка из описания тоже удалено,
выравнивание сохранено в
файле снова в формате fasta.
Файл с выравниванием был открыт программой MEGA (File -> Open, согласиться на Analyze и выделить строчку белков),
далее методом максимальной экономии ("Maximum parsimony") построено дерево (Analysis -> Phylogeny -> ...) и сохранено в png (Рис. 7) и nwk.
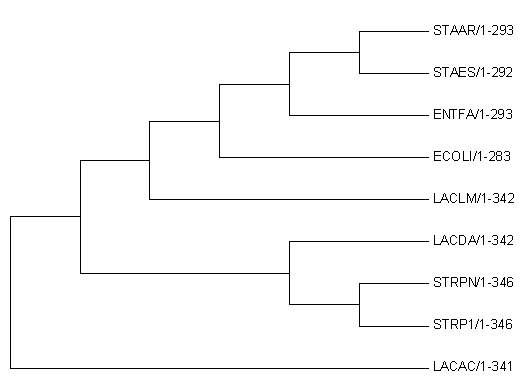
Рисунок 7.
Maximum Parsimony analysis of taxa (+ E.coli) .nwk
The evolutionary history was inferred using the Maximum Parsimony method. The most parsimonious tree with length = 519 is shown. The consistency index is 0.840077 (0.806977), the retention index is 0.716724 (0.716724), and the composite index is 0.602103 (0.578379) for all sites and parsimony-informative sites (in parentheses). The MP tree was obtained using the Subtree-Pruning-Regrafting (SPR) algorithm (pg. 126 in ref. [1]) with search level 0 in which the initial trees were obtained by the random addition of sequences (10 replicates). The analysis involved 9 amino acid sequences. All positions containing gaps and missing data were eliminated. There were a total of 280 positions in the final dataset. Evolutionary analyses were conducted in MEGA7 [2].
1. Nei M. and Kumar S. (2000). Molecular Evolution and Phylogenetics. Oxford University Press, New York.
2. Kumar S., Stecher G., and Tamura K. (2016). MEGA7: Molecular Evolutionary Genetics Analysis version 7.0 for bigger datasets.Molecular Biology and Evolution 33:1870-1874.
По инструкции с kodomo: "После реконструкции дерева нужно в меню Subtree выбрать Root и указать в качестве корня ветвь, ведущую к ECOLI"
получено дерево (Рис. 8).
Рисунок 8.
Maximum Parsimony analysis of taxa (+ E.coli-root)
The evolutionary history was inferred using the Maximum Parsimony method. The most parsimonious tree with length = 519 is shown. The consistency index is 0.840077 (0.806977), the retention index is 0.716724 (0.716724), and the composite index is 0.602103 (0.578379) for all sites and parsimony-informative sites (in parentheses). The MP tree was obtained using the Subtree-Pruning-Regrafting (SPR) algorithm (pg. 126 in ref. [1]) with search level 0 in which the initial trees were obtained by the random addition of sequences (10 replicates). The analysis involved 9 amino acid sequences. All positions containing gaps and missing data were eliminated. There were a total of 280 positions in the final dataset. Evolutionary analyses were conducted in MEGA7 [2].
1. Nei M. and Kumar S. (2000). Molecular Evolution and Phylogenetics. Oxford University Press, New York.
2. Kumar S., Stecher G., and Tamura K. (2016). MEGA7: Molecular Evolutionary Genetics Analysis version 7.0 for bigger datasets.Molecular Biology and Evolution 33:1870-1874.
Далее по инструкции с kodomo: "чтобы получить изображение укоренённого дерева без ECOLI,
нужно воспользовавться кнопкой "Show Subtree Separately" (изображение голубой лупы на фоне дерева на левой панели окна MEGA)"
получено изображение (Рис. 9).
Рисунок 9.
Maximum Parsimony analysis of taxa (+ E.coli-root), изображение укоренённого дерева без ECOLI.nwk
Бутстрэп
"При бутстрэп-анализе (bootstrap — «петля на заднике ботинка») из исходного выравнивания в результате случайного удаления половины столбцов и заменой их копиями других (тоже случайно выбранных) столбцов создается бутстрэп-реплика. Создается их много (100-500). Далее для каждой реплики строится дерево, а из них по методу расширенного большинства (сначала строится дерево из ветвей, встретившихся в большинстве исходных деревьев, а потом к нему добавляются ветви, не противоречащие уже имеющимся) строится т.н. консенсусное дерево. При этом длины ветвей теряются, а ветви подписываются бутстрэп-поддержкой — процентом деревьев, в которых встретилась данная ветвь (нетривиальная)."
Файл с выравниванием был открыт программой MEGA (File -> Open, согласиться на Analyze и выделить строчку белков),
далее методом Neighbor-Joining построено дерево (Analysis -> Phylogeny -> Neighbor-Joining, при этом в окошке надо было выбрано
est of Phylogeny - Bootstrap method, число реплик 100) и сохранено в png и nwk.
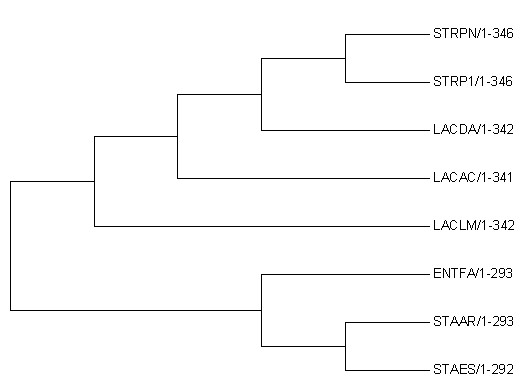
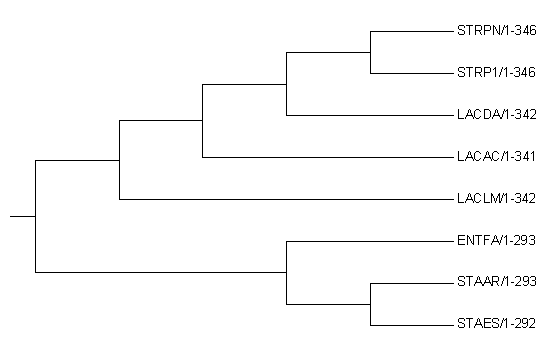
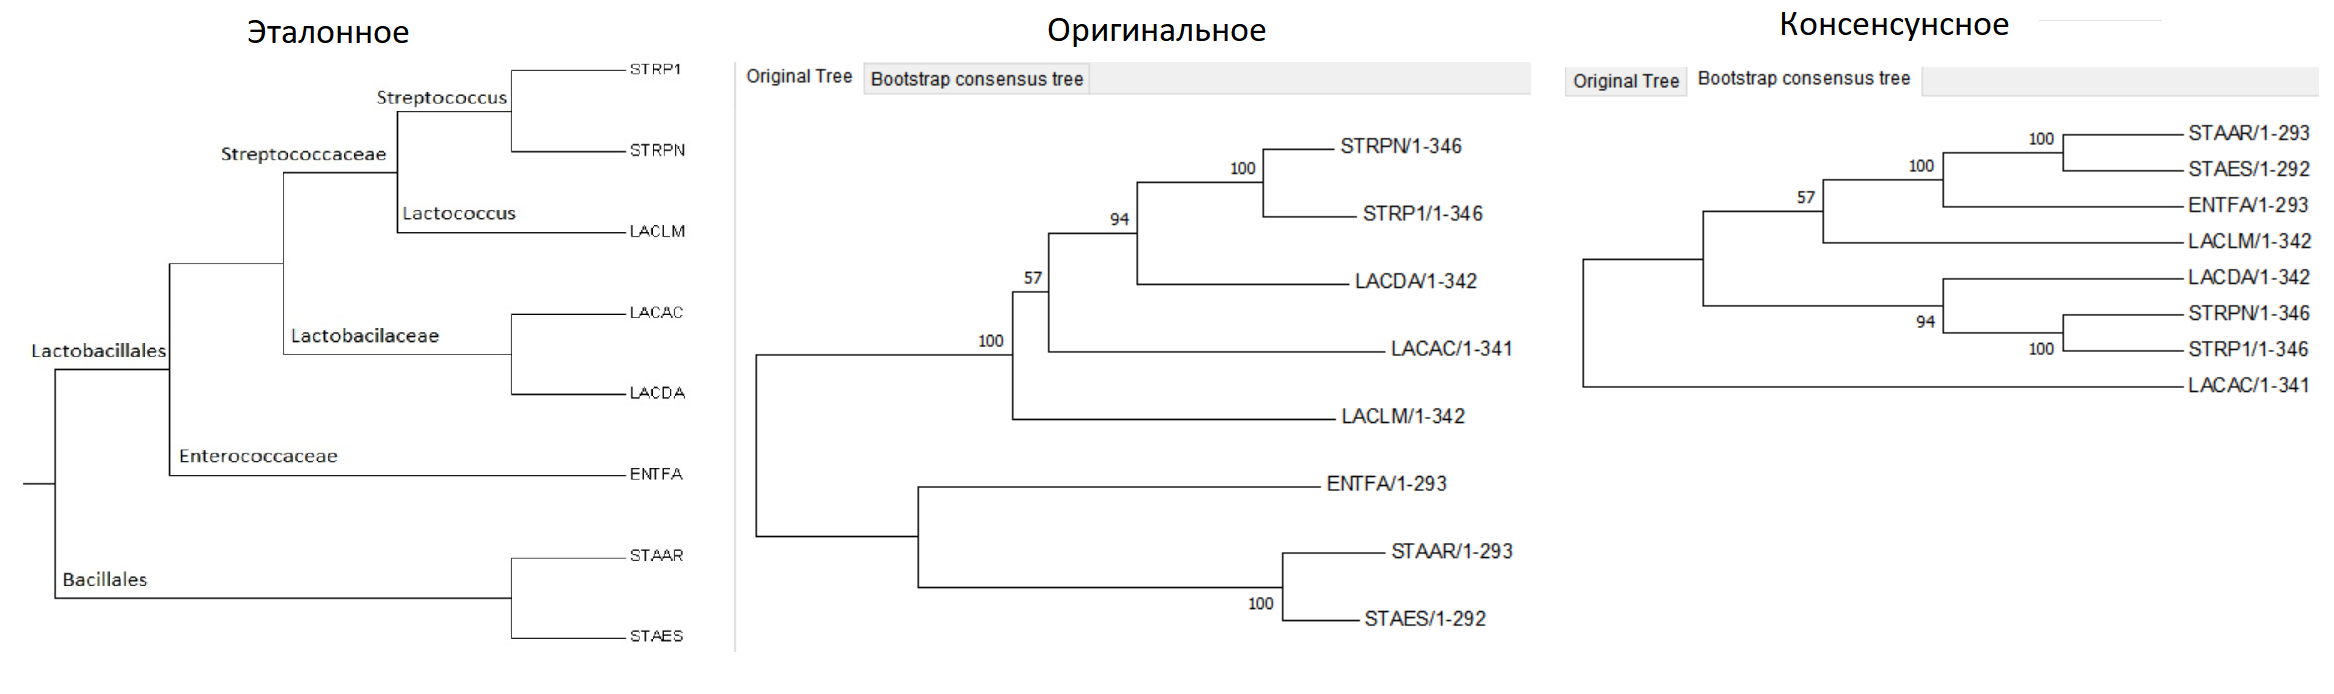
Рисунок 10.
.nwk для bootstrap
Эталонное дерево по систематическому положению & Дерево, построенное Neighbor-Joining method (original) & Дерево, построенное Neighbor-Joining method с помощью бутстрэп-анализа (consensus)
16S
В списке по ссылке ftp://ftp.ncbi.nlm.nih.gov/genomes/archive/old_refseq/Bacteria/
был найден all.frn.tar.gz, в котором лежит информация по разным штаммов разных бактерий.
Из fastа файлов вырезаны последовательности 16S рРНК и положены в файл
16S.fasta с заменой длинных названий
на мнемоники видов. В Jalview File -> Input alignment -> Выбор 16.fasta. Далее выравнивание с помощью Muscle (Web Service -> Alignment -> ...).
Выравнивание сохранено в файл
16Salign.fa.
Файл с выравниванием был открыт программой MEGA (File -> Open, согласиться на Analyze и выделить строчку нуклеотидов),
далее разными способами построены деревья (Analysis -> Phylogeny -> ...).