Practise 11. Homology and alignment.
1. Selecting Domain Families from Pfam for Analysis
I chose the MTaX1 family because it matched the parameters specified in the assignment. The selection was made randomly..
2. Domain family description
Name:MTaX1 (Methylase-associated X1)
Function:Proteins from this family are involved in catalysis of ATP hydrolysis and use its free energy for a wide range of functions..[1]
Overall sample size (Full):99
Number of sequences in the alignment (Seed):71
This family includes 6 domain architectures
I chose the 2 most represented architectures:
1)W4UYW2_9BACE - includes 64 sequences.
2)A0A2U0HZL0_9FLAO - includes 21 sequences.
There are no known 3D structures for proteins in this family.
Proteins of this family are found in the Bacteria domain
Date of HMM profile creation: Thu Oct 14 05:35:08 2021
Number of positions in the HMM profile:110
HMM profile3. Building a local similarity map (Dot Plot)
Proteins with the most common architectures were chosen for comparison(W4UYW2_9BACE,A0A2U0HZL0_9FLAO)
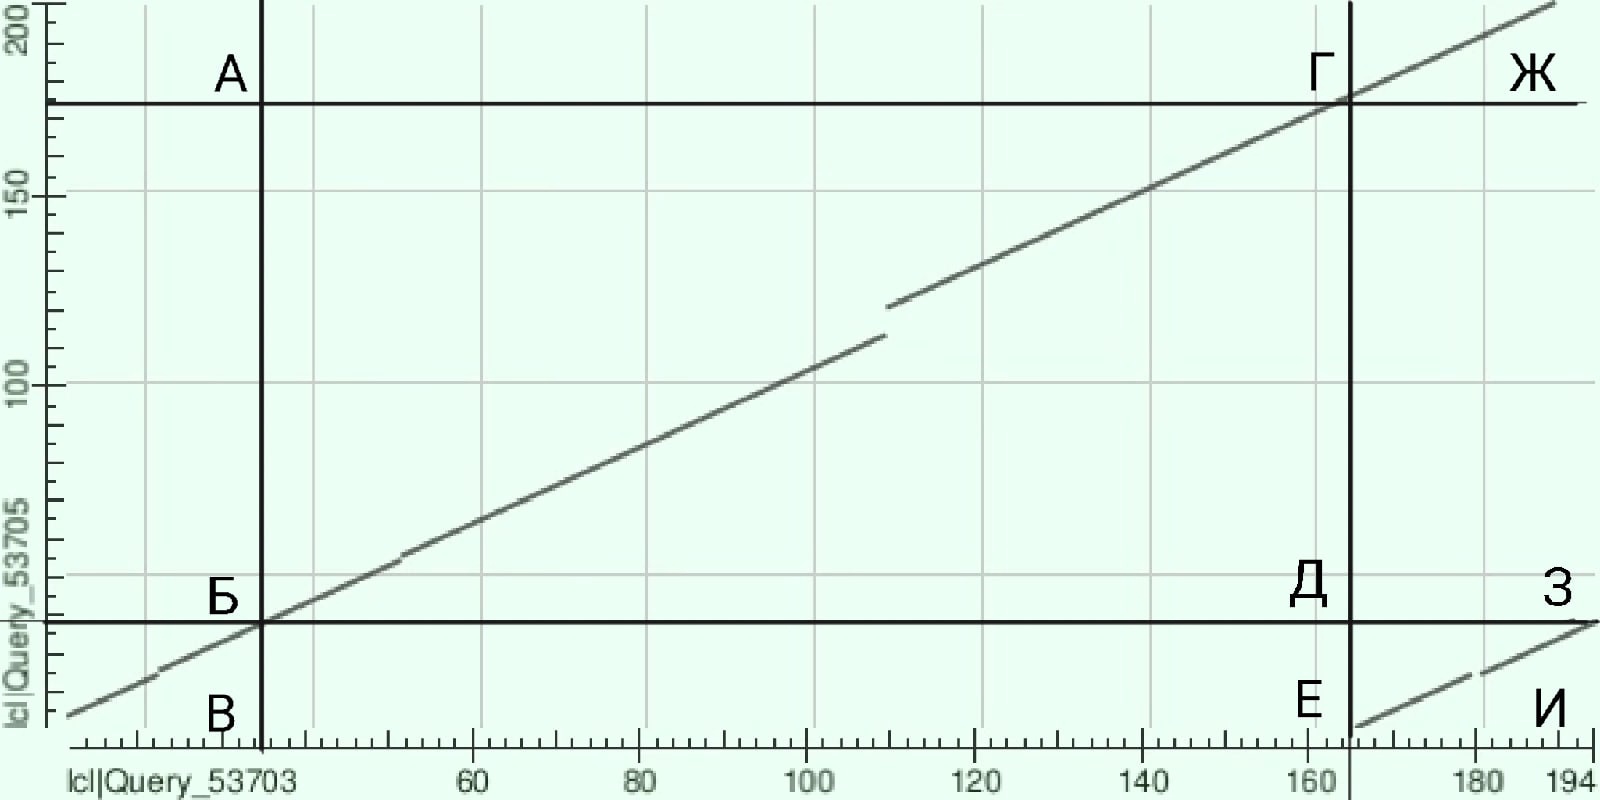
The graph is quite unusual, so the map was drawn with a vertical line through the beginning of the small diagonal and a horizontal line through its end, then the lines passing through the points of intersection of these diagonals were added the intersection of these with the diagonals. Thus, the map is divided into 9 rectangles, each marked with a letter.
Consider the rectangles individually:
В: on this section of the chain are extremely similar, there are no major differences (which may have occurred as a result of deletions/insertions). However, there is still a small fragment where a deletion or insertion one amino acid long.
Д: there is a gap at this site corresponding to an insertion/deletion of 10 amino acids.
Ж: the sequences are similar, there are no gaps
И: there is a gap corresponding to the insertion/deletion/insertion of 1 amino acid.
It is also probably possible to note the similarity of the fragments of the chains of rectangles B and И.
The presence of two lines is probably due to duplication.
To get a better understanding, I decided to try to build a local similarity map by increasing and decreasing the threshold on the E-value.
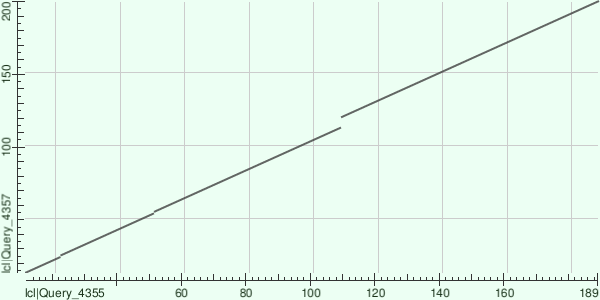
As the E-value threshold value decreases, line 2 on the graph disappears. However, at positions 23,53, and 110, there were remaining sites with a gap resulting from amino acid insertion/deletion. Possibly, the second line on the graph at such a low E-value is not displayed, because the program considered that such similarity could occur as a result of coincidence and removed it.
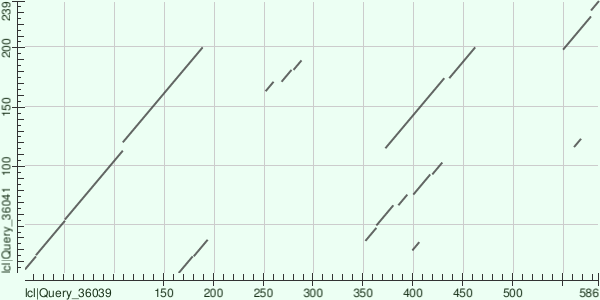
In the graph with the increased E-value threshold, as you can see, the map length has increased from 189 to 586. This is due to the fact that with this E-value many similarities are displayed on the graph, which can be considered random at lower values of E-value. However, it should be noted that in the section from 10 to 189 amino acid residues, the graph behaves in the same way as the original graph.
4. Alignment of family domains based on the similarity of two subsets of Pfam domains
Most of the proteins in the dark green and blue groups have threonine at the 11th position, while the sequences in the light green group have tyrosine at this position. Both amino acids have uncharged polar radicals, yet this difference is probably significant and can affect the properties of proteins.
Sequences from the dark green group have different amino acids at the 14th position, and sequences from other groups have glycine at this position (if we take into account that in the majority of representatives of the dark green group occurs proline, we can conclude that proteins from different groups differ greatly at this point. Replacing these amino acids with each other can affect the spatial structure of the protein.)
Most proteins in the dark blue group have glycine at position 79, while proteins in the dark green group have leucine or valine (these amino acids differ from each other by only one methyl group, so when these amino acids are substituted for each other, the sites can still be considered related), the sequences of the lettuce group do not have unambiguity at this point.
Leucine is found at the 86th position in many blue proteins, and phenylalanine is found in the sequences of the emerald group (leucine and isoleucine are also quite common, which could similarities with the blue group). But the cysteine is in this position in the sequences of the lettuce group. The appearance of sulfur strongly distinguishes it from other groups.
Most sequences in the dark blue and dark green groups have aspartate in the 111th place, and those in the light green group have proline. Aspartate has a negatively charged radical, and proline is an uncharged (hydrophobic) amino acid. This distinction is probably important when dividing into groups.
Most of the proteins in the dark blue and light green groups have alanine at 152, and those in the dark green group have isoleucine. Both amino acids are hydrophobic and differ in several methyl groups In the dark green group sequences, tryptophan is located at the 166th position, and in the light green group, histidine is located at the 166th position. And the proteins in the dark blue group have a gap at this point.
Project with alignment5.Table with proteins from Uniprot with the Pfam family domain
Because the query:database:(type:pfam pf20296) did not find any record in Uniprot (probably due to the fact that the data are new). So I decided to choose a different family for the work. The query in Uniprot: database:(type:pfam pf18801). Table