WHAT IF Check report

This file was created 2011-12-28 from WHAT_CHECK output by a conversion script. If you are new to WHAT_CHECK, please study the pdbreport pages. There also exists a legend to the output.

Please note that you are looking at an abridged version of the output (all checks that gave normal results have been removed from this report). You can have a look at the Full report instead.

Verification log for pdb1i6n.ent

Non-validating, descriptive output paragraph

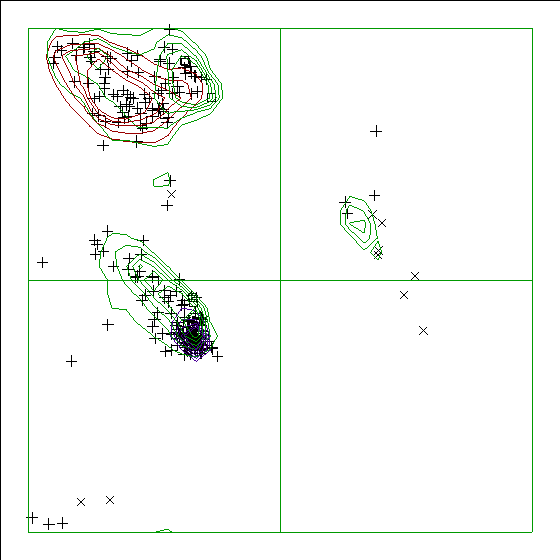
Note: Ramachandran plot

In this Ramachandran plot x-signs represent glycines, squares represent prolines, and plus-signs represent the other residues. If too many plus- signs fall outside the contoured areas then the molecule is poorly refined (or worse). Proline can only occur in the narrow region around phi=-60 that also falls within the other contour islands.

In a colour picture, the residues that are part of a helix are shown in blue, strand residues in red. Preferred regions for helical residues are drawn in blue, for strand residues in red, and for all other residues in green. A full explanation of the Ramachandran plot together with a series of examples can be found at the WHAT_CHECK website.

Chain identifier: A

Coordinate problems, unexpected atoms, B-factor and occupancy checks

Warning: What type of B-factor?

WHAT IF does not yet know well how to cope with B-factors in case TLS has been used. It simply assumes that the B-factor listed on the ATOM and HETATM cards are the total B-factors. When TLS refinement is used that assumption sometimes is not correct. TLS seems not mentioned in the header of the PDB file. But anyway, if WHAT IF complains about your B-factors, and you think that they are OK, then check for TLS related B-factor problems first.

Obviously, the temperature at which the X-ray data was collected has some importance too:

Crystal temperature (K) :100.000
Note: B-factor plot

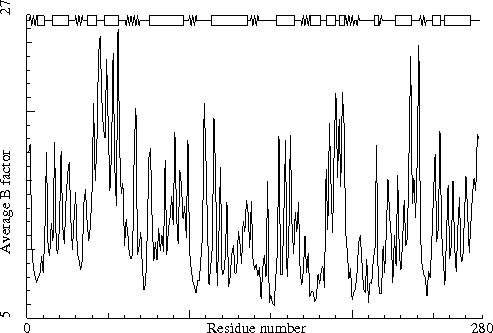
The average atomic B-factor per residue is plotted as function of the residue number.

Chain identifier: A

Nomenclature related problems

Warning: Phenylalanine convention problem

The phenylalanine residues listed in the table below have their chi-2 not between -90.0 and 90.0.

 248 PHE   ( 248-)  A

Geometric checks

Warning: Low bond length variability

Bond lengths were found to deviate less than normal from the mean Engh and Huber [REF] and/or Parkinson et al [REF] standard bond lengths. The RMS Z-score given below is expected to be near 1.0 for a normally restrained data set. The fact that it is lower than 0.667 in this structure might indicate that too-strong restraints have been used in the refinement. This can only be a problem for high resolution X-ray structures.

RMS Z-score for bond lengths: 0.259
RMS-deviation in bond distances: 0.012

Warning: Unusual bond angles

The bond angles listed in the table below were found to deviate more than 4 sigma from standard bond angles (both standard values and sigma for protein residues have been taken from Engh and Huber [REF], for DNA/RNA from Parkinson et al [REF]). In the table below for each strange angle the bond angle and the number of standard deviations it differs from the standard values is given. Please note that disulphide bridges are neglected. Atoms starting with "-" belong to the previous residue in the sequence.

  67 ALA   (  67-)  A      N    CA   C   126.59    5.5
  68 LEU   (  68-)  A      N    CA   C    85.50   -9.2
 172 VAL   ( 172-)  A      N    CA   C    99.33   -4.2

Warning: Low bond angle variability

Bond angles were found to deviate less than normal from the standard bond angles (normal values for protein residues were taken from Engh and Huber [REF], for DNA/RNA from Parkinson et al [REF]). The RMS Z-score given below is expected to be near 1.0 for a normally restrained data set. The fact that it is lower than 0.667 in this structure might indicate that too-strong restraints have been used in the refinement. This can only be a problem for high resolution X-ray structures.

RMS Z-score for bond angles: 0.650
RMS-deviation in bond angles: 1.454

Error: Tau angle problems

The side chains of the residues listed in the table below contain a tau angle (N-Calpha-C) that was found to deviate from te expected value by more than 4.0 times the expected standard deviation. The number in the table is the number of standard deviations this RMS value deviates from the expected value.

  68 LEU   (  68-)  A   10.42
  67 ALA   (  67-)  A    7.29
 180 ALA   ( 180-)  A    5.73
  69 VAL   (  69-)  A    4.52
 172 VAL   ( 172-)  A    4.28
   7 GLU   (   7-)  A    4.13

Warning: High tau angle deviations

The RMS Z-score for the tau angles (N-Calpha-C) in the structure is too high. For well refined structures this number is expected to be near 1.0. The fact that it is higher than 1.5 worries us. However, we determined the tau normal distributions from 500 high-resolution X-ray structures, rather than from CSD data, so we cannot be 100 percent certain about these numbers.

Tau angle RMS Z-score : 1.694

Torsion-related checks

Warning: Torsion angle evaluation shows unusual residues

The residues listed in the table below contain bad or abnormal torsion angles.

These scores give an impression of how `normal' the torsion angles in protein residues are. All torsion angles except omega are used for calculating a `normality' score. Average values and standard deviations were obtained from the residues in the WHAT IF database. These are used to calculate Z-scores. A residue with a Z-score of below -2.0 is poor, and a score of less than -3.0 is worrying. For such residues more than one torsion angle is in a highly unlikely position.

  70 PHE   (  70-)  A    -2.8
 108 THR   ( 108-)  A    -2.3
 242 VAL   ( 242-)  A    -2.2
 204 THR   ( 204-)  A    -2.2
 202 ASP   ( 202-)  A    -2.2
 185 ILE   ( 185-)  A    -2.1

Warning: Backbone evaluation reveals unusual conformations

The residues listed in the table below have abnormal backbone torsion angles.

Residues with `forbidden' phi-psi combinations are listed, as well as residues with unusual omega angles (deviating by more than 3 sigma from the normal value). Please note that it is normal if about 5 percent of the residues is listed here as having unusual phi-psi combinations.

  67 ALA   (  67-)  A  Poor phi/psi
  70 PHE   (  70-)  A  Poor phi/psi
 202 ASP   ( 202-)  A  Poor phi/psi
 206 ASP   ( 206-)  A  Poor phi/psi
 240 SER   ( 240-)  A  Poor phi/psi
 chi-1/chi-2 correlation Z-score : -0.085

Warning: Unusual rotamers

The residues listed in the table below have a rotamer that is not seen very often in the database of solved protein structures. This option determines for every residue the position specific chi-1 rotamer distribution. Thereafter it verified whether the actual residue in the molecule has the most preferred rotamer or not. If the actual rotamer is the preferred one, the score is 1.0. If the actual rotamer is unique, the score is 0.0. If there are two preferred rotamers, with a population distribution of 3:2 and your rotamer sits in the lesser populated rotamer, the score will be 0.667. No value will be given if insufficient hits are found in the database.

It is not necessarily an error if a few residues have rotamer values below 0.3, but careful inspection of all residues with these low values could be worth it.

 121 SER   ( 121-)  A    0.36

Warning: Unusual backbone conformations

For the residues listed in the table below, the backbone formed by itself and two neighbouring residues on either side is in a conformation that is not seen very often in the database of solved protein structures. The number given in the table is the number of similar backbone conformations in the database with the same amino acid in the centre.

For this check, backbone conformations are compared with database structures using C-alpha superpositions with some restraints on the backbone oxygen positions.

A residue mentioned in the table can be part of a strange loop, or there might be something wrong with it or its directly surrounding residues. There are a few of these in every protein, but in any case it is worth looking at!

  10 THR   (  10-)  A      0
  11 LEU   (  11-)  A      0
  13 ASN   (  13-)  A      0
  14 SER   (  14-)  A      0
  36 MSE   (  36-)  A      0
  37 ASP   (  37-)  A      0
  38 LYS   (  38-)  A      0
  45 ASP   (  45-)  A      0
  46 HIS   (  46-)  A      0
  57 THR   (  57-)  A      0
  58 HIS   (  58-)  A      0
  64 ALA   (  64-)  A      0
  66 ASN   (  66-)  A      0
  67 ALA   (  67-)  A      0
  68 LEU   (  68-)  A      0
  69 VAL   (  69-)  A      0
  70 PHE   (  70-)  A      0
  71 PHE   (  71-)  A      0
  72 ASN   (  72-)  A      0
  89 MSE   (  89-)  A      0
  90 MSE   (  90-)  A      0
 109 GLU   ( 109-)  A      0
 135 TYR   ( 135-)  A      0
 152 ASN   ( 152-)  A      0
 164 VAL   ( 164-)  A      0
And so on for a total of 85 lines.

Warning: Omega angles too tightly restrained

The omega angles for trans-peptide bonds in a structure are expected to give a gaussian distribution with the average around +178 degrees and a standard deviation around 5.5 degrees. These expected values were obtained from very accurately determined structures. Many protein structures are too tightly restrained. This seems to be the case with the current structure too, as the observed standard deviation is below 4.0 degrees.

Standard deviation of omega values : 1.671

Warning: Unusual peptide bond conformations

For the residues listed in the table below, the backbone formed by the residue mentioned and the one C-terminal of it show systematic angular deviations from normality that are consistent with a cis-peptide that accidentally got refine in a trans conformation. This check follows the recommendations by Jabs, Weiss, and Hilgenfeld [REF]. This check has not yet fully matured...

  66 ASN   (  66-)  A   1.63

Bump checks

Error: Abnormally short interatomic distances

The pairs of atoms listed in the table below have an unusually short interactomic distance; each bump is listed in only one direction.

The contact distances of all atom pairs have been checked. Two atoms are said to `bump' if they are closer than the sum of their Van der Waals radii minus 0.40 Angstrom. For hydrogen bonded pairs a tolerance of 0.55 Angstrom is used. The first number in the table tells you how much shorter that specific contact is than the acceptable limit. The second distance is the distance between the centres of the two atoms. Although we believe that two water atoms at 2.4 A distance are too close, we only report water pairs that are closer than this rather short distance.

The last text-item on each line represents the status of the atom pair. If the final column contains the text 'HB', the bump criterion was relaxed because there could be a hydrogen bond. Similarly relaxed criteria are used for 1-3 and 1-4 interactions (listed as 'B2' and 'B3', respectively). BL indicates that the B-factors of the clashing atoms have a low B-factor thereby making this clash even more worrisome. INTRA and INTER indicate whether the clashes are between atoms in the same asymmetric unit, or atoms in symmetry related asymmetric units, respectively.

 223 GLY   ( 223-)  A      N   <->  281 HOH   ( 568 )  A      O      0.39    2.31  INTRA
 219 TRP   ( 219-)  A      O   <->  281 HOH   ( 568 )  A      O      0.25    2.15  INTRA
   1 MSE   (   1-)  A      N   <->  281 HOH   ( 489 )  A      O      0.23    2.47  INTRA
 222 GLN   ( 222-)  A      C   <->  281 HOH   ( 568 )  A      O      0.18    2.62  INTRA
 218 VAL   ( 218-)  A      CG2 <->  281 HOH   ( 568 )  A      O      0.18    2.62  INTRA
 203 ASP   ( 203-)  A      CB  <->  281 HOH   ( 568 )  A      O      0.15    2.65  INTRA
 146 HIS   ( 146-)  A      ND1 <->  148 GLN   ( 148-)  A      N      0.13    2.87  INTRA BL
  58 HIS   (  58-)  A      O   <->   61 LYS   (  61-)  A      NZ     0.11    2.59  INTRA BL
 242 VAL   ( 242-)  A      CG2 <->  243 VAL   ( 243-)  A      N      0.10    2.90  INTRA BL
 176 PHE   ( 176-)  A      O   <->  180 ALA   ( 180-)  A      N      0.09    2.61  INTRA BL
 170 GLY   ( 170-)  A      N   <->  197 PHE   ( 197-)  A      CE2    0.09    3.01  INTRA BL
 222 GLN   ( 222-)  A      N   <->  281 HOH   ( 568 )  A      O      0.05    2.65  INTRA
 241 ASP   ( 241-)  A      OD1 <->  242 VAL   ( 242-)  A      N      0.05    2.55  INTRA
  93 CYS   (  93-)  A      O   <->   97 GLY   (  97-)  A      N      0.04    2.66  INTRA BL
  39 LEU   (  39-)  A      N   <->   40 PRO   (  40-)  A      CD     0.02    2.98  INTRA BL
 195 LYS   ( 195-)  A      NZ  <->  281 HOH   ( 509 )  A      O      0.01    2.69  INTRA
 109 GLU   ( 109-)  A      N   <->  110 GLN   ( 110-)  A      N      0.01    2.59  INTRA BL
  45 ASP   (  45-)  A      CG  <->   46 HIS   (  46-)  A      CE1    0.01    3.19  INTRA
  29 ASP   (  29-)  A      OD1 <->   59 HIS   (  59-)  A      CE1    0.01    2.79  INTRA BL
 179 HIS   ( 179-)  A      CD2 <->  281 HOH   ( 406 )  A      O      0.01    2.79  INTRA BL
Packing, accessibility and threading

Note: Inside/Outside RMS Z-score plot

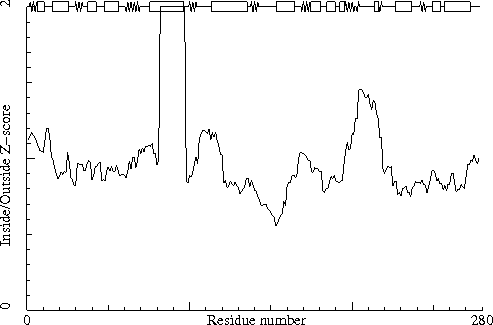
The Inside/Outside distribution normality RMS Z-score over a 15 residue window is plotted as function of the residue number. High areas in the plot (above 1.5) indicate unusual inside/outside patterns.

Chain identifier: A

Warning: Abnormal packing environment for some residues

The residues listed in the table below have an unusual packing environment.

The packing environment of the residues is compared with the average packing environment for all residues of the same type in good PDB files. A low packing score can indicate one of several things: Poor packing, misthreading of the sequence through the density, crystal contacts, contacts with a co-factor, or the residue is part of the active site. It is not uncommon to see a few of these, but in any case this requires further inspection of the residue.

 222 GLN   ( 222-)  A      -5.96
 134 PRO   ( 134-)  A      -5.62
 179 HIS   ( 179-)  A      -5.57
 111 LYS   ( 111-)  A      -5.04
Note: Quality value plot

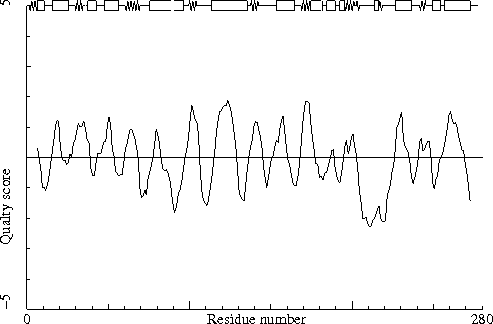
The quality value smoothed over a 10 residue window is plotted as function of the residue number. Low areas in the plot (below -2.0) indicate unusual packing.

Chain identifier: A

Warning: Abnormal packing Z-score for sequential residues

A stretch of at least four sequential residues with a 2nd generation packing Z-score below -1.75 was found. This could indicate that these residues are part of a strange loop or that the residues in this range are incomplete, but it might also be an indication of misthreading.

The table below lists the first and last residue in each stretch found, as well as the average residue Z-score of the series.

 208 PRO   ( 208-)  A     -  211 PHE   ( 211-)  A        -1.63
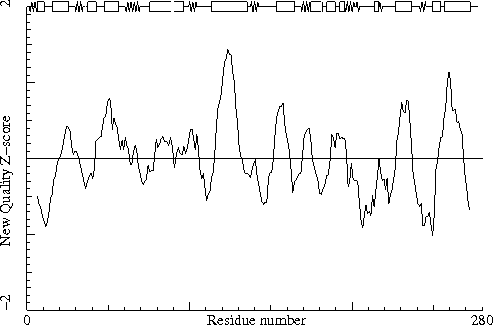
Note: Second generation quality Z-score plot

The second generation quality Z-score smoothed over a 10 residue window is plotted as function of the residue number. Low areas in the plot (below -1.3) indicate unusual packing.

Chain identifier: A

Water, ion, and hydrogenbond related checks

Error: HIS, ASN, GLN side chain flips

Listed here are Histidine, Asparagine or Glutamine residues for which the orientation determined from hydrogen bonding analysis are different from the assignment given in the input. Either they could form energetically more favourable hydrogen bonds if the terminal group was rotated by 180 degrees, or there is no assignment in the input file (atom type 'A') but an assignment could be made. Be aware, though, that if the topology could not be determined for one or more ligands, then this option will make errors.

  80 ASN   (  80-)  A
 179 HIS   ( 179-)  A

Warning: Buried unsatisfied hydrogen bond donors

The buried hydrogen bond donors listed in the table below have a hydrogen atom that is not involved in a hydrogen bond in the optimized hydrogen bond network.

Hydrogen bond donors that are buried inside the protein normally use all of their hydrogens to form hydrogen bonds within the protein. If there are any non hydrogen bonded buried hydrogen bond donors in the structure they will be listed here. In very good structures the number of listed atoms will tend to zero.

Waters are not listed by this option.

  12 GLU   (  12-)  A      N
  13 ASN   (  13-)  A      ND2
  37 ASP   (  37-)  A      N
  64 ALA   (  64-)  A      N
  66 ASN   (  66-)  A      ND2
 107 VAL   ( 107-)  A      N
 143 PHE   ( 143-)  A      N
 153 THR   ( 153-)  A      N
 181 MSE   ( 181-)  A      N
 202 ASP   ( 202-)  A      N
 248 PHE   ( 248-)  A      N
Only metal coordination for  142 GLU  ( 142-) A      OE2
Only metal coordination for  174 ASP  ( 174-) A      OD2
Only metal coordination for  200 HIS  ( 200-) A      ND1

Warning: Buried unsatisfied hydrogen bond acceptors

The buried side-chain hydrogen bond acceptors listed in the table below are not involved in a hydrogen bond in the optimized hydrogen bond network.

Side-chain hydrogen bond acceptors buried inside the protein normally form hydrogen bonds within the protein. If there are any not hydrogen bonded in the optimized hydrogen bond network they will be listed here.

Waters are not listed by this option.

   7 GLU   (   7-)  A      OE2
 202 ASP   ( 202-)  A      OD2

Warning: Possible wrong residue type

The residues listed in the table below have a weird environment that cannot be improved by rotamer flips. This can mean one of three things, non of which WHAT CHECK really can do much about. 1) The side chain has actually another rotamer than is present in the PDB file; 2) A counter ion is present in the structure but is not given in the PDB file; 3) The residue actually is another amino acid type. The annotation 'Alt-rotamer' indicates that WHAT CHECK thinks you might want to find an alternate rotamer for this residue. The annotation 'Sym-induced' indicates that WHAT CHECK believes that symmetry contacts might have something to do with the difficulties of this residue's side chain. Determination of these two annotations is difficult, so their absence is less meaningful than their presence. The annotation Ligand-bound indicates that a ligand seems involved with this residue. In nine of ten of these cases this indicates that the ligand is causing the weird situation rather than the residue.

  45 ASP   (  45-)  A   H-bonding suggests Asn
 270 ASP   ( 270-)  A   H-bonding suggests Asn

Final summary

Note: Summary report for users of a structure

This is an overall summary of the quality of the structure as compared with current reliable structures. This summary is most useful for biologists seeking a good structure to use for modelling calculations.

The second part of the table mostly gives an impression of how well the model conforms to common refinement restraint values. The first part of the table shows a number of global quality indicators.


Structure Z-scores, positive is better than average:

  1st generation packing quality :   0.974
  2nd generation packing quality :  -0.200
  Ramachandran plot appearance   :  -0.064
  chi-1/chi-2 rotamer normality  :  -0.085
  Backbone conformation          :   0.196

RMS Z-scores, should be close to 1.0:
  Bond lengths                   :   0.259 (tight)
  Bond angles                    :   0.650 (tight)
  Omega angle restraints         :   0.304 (tight)
  Side chain planarity           :   0.254 (tight)
  Improper dihedral distribution :   0.549
  B-factor distribution          :   0.782
  Inside/Outside distribution    :   0.951

Note: Summary report for depositors of a structure

This is an overall summary of the quality of the X-ray structure as compared with structures solved at similar resolutions. This summary can be useful for a crystallographer to see if the structure makes the best possible use of the data. Warning. This table works well for structures solved in the resolution range of the structures in the WHAT IF database, which is presently (summer 2008) mainly 1.1 - 1.3 Angstrom. The further the resolution of your file deviates from this range the more meaningless this table becomes.

The second part of the table mostly gives an impression of how well the model conforms to common refinement restraint values. The first part of the table shows a number of global quality indicators, which have been calibrated against structures of similar resolution.

Resolution found in PDB file : 1.80


Structure Z-scores, positive is better than average:

  1st generation packing quality :   1.3
  2nd generation packing quality :  -0.6
  Ramachandran plot appearance   :   0.0
  chi-1/chi-2 rotamer normality  :   0.2
  Backbone conformation          :  -0.0

RMS Z-scores, should be close to 1.0:
  Bond lengths                   :   0.259 (tight)
  Bond angles                    :   0.650 (tight)
  Omega angle restraints         :   0.304 (tight)
  Side chain planarity           :   0.254 (tight)
  Improper dihedral distribution :   0.549
  B-factor distribution          :   0.782
  Inside/Outside distribution    :   0.951
==============
WHAT IF
    G.Vriend,
      WHAT IF: a molecular modelling and drug design program,
    J. Mol. Graph. 8, 52--56 (1990).

WHAT_CHECK (verification routines from WHAT IF)
    R.W.W.Hooft, G.Vriend, C.Sander and E.E.Abola,
      Errors in protein structures
    Nature 381, 272 (1996).
    (see also http://swift.cmbi.ru.nl/gv/whatcheck for a course and extra inform

Bond lengths and angles, protein residues
    R.Engh and R.Huber,
      Accurate bond and angle parameters for X-ray protein structure
      refinement,
    Acta Crystallogr. A47, 392--400 (1991).

Bond lengths and angles, DNA/RNA
    G.Parkinson, J.Voitechovsky, L.Clowney, A.T.Bruenger and H.Berman,
      New parameters for the refinement of nucleic acid-containing structures
    Acta Crystallogr. D52, 57--64 (1996).

DSSP
    W.Kabsch and C.Sander,
      Dictionary of protein secondary structure: pattern
      recognition of hydrogen bond and geometrical features
    Biopolymers 22, 2577--2637 (1983).

Hydrogen bond networks
    R.W.W.Hooft, C.Sander and G.Vriend,
      Positioning hydrogen atoms by optimizing hydrogen bond networks in
      protein structures
    PROTEINS, 26, 363--376 (1996).

Matthews' Coefficient
    B.W.Matthews
      Solvent content of Protein Crystals
    J. Mol. Biol. 33, 491--497 (1968).

Protein side chain planarity
    R.W.W. Hooft, C. Sander and G. Vriend,
      Verification of protein structures: side-chain planarity
    J. Appl. Cryst. 29, 714--716 (1996).

Puckering parameters
    D.Cremer and J.A.Pople,
      A general definition of ring puckering coordinates
    J. Am. Chem. Soc. 97, 1354--1358 (1975).

Quality Control
    G.Vriend and C.Sander,
      Quality control of protein models: directional atomic
      contact analysis,
    J. Appl. Cryst. 26, 47--60 (1993).

Ramachandran plot
    G.N.Ramachandran, C.Ramakrishnan and V.Sasisekharan,
      Stereochemistry of Polypeptide Chain Conformations
    J. Mol. Biol. 7, 95--99 (1963).

Symmetry Checks
    R.W.W.Hooft, C.Sander and G.Vriend,
      Reconstruction of symmetry related molecules from protein
      data bank (PDB) files
    J. Appl. Cryst. 27, 1006--1009 (1994).

Ion Checks
    I.D.Brown and K.K.Wu,
      Empirical Parameters for Calculating Cation-Oxygen Bond Valences
    Acta Cryst. B32, 1957--1959 (1975).

    M.Nayal and E.Di Cera,
      Valence Screening of Water in Protein Crystals Reveals Potential Na+
      Binding Sites
    J.Mol.Biol. 256 228--234 (1996).

    P.Mueller, S.Koepke and G.M.Sheldrick,
      Is the bond-valence method able to identify metal atoms in protein
      structures?
    Acta Cryst. D 59 32--37 (2003).

Checking checks
    K.Wilson, C.Sander, R.W.W.Hooft, G.Vriend, et al.
      Who checks the checkers
    J.Mol.Biol. (1998) 276,417-436.