Review of genome of Trichlorobacter lovleyi
Authors: Elizaveta Umarova. student of Moscow State University, faculty of Bioengineering and Bioinformatics
>Abstract
Bacteria from Geobacter order can reduce a lot of different chemicals so knowing more information about their genome is significant for nowadays’ industries. This article is an overview of the genome of Trichlorobacter lovleyi which can make a big contribution to cleaning the environment from different compounds.
1 Introduction
Trichlorobacter lovleyi is an anaerobic Gram-negative [1] bacterium. It belongs to a distinct dechlorinating clade within the Geobacter group and is capable of deriving energy from acetate oxidation coupled to the reduction of tetrachloroethene (PCE) to cis-1,2-dichloroethene (cis-DCE), i.e., performing chlororespiration. T. lovleyi is one of the key organohalide-respiring bacteria (OHRB) [3]. This species is prevalent in nitrate ammonification hotspots [4]. Notably, Trichlorobacter lovleyi metabolically reduces a wide range of electron acceptors, including oxidized metals, radionuclides (e.g., hexavalent uranium), and nitrate. The species was named in honor of Derek R. Lovley in recognition of his contributions to our understanding of microbial metal and radionuclide reduction[1].
Table 1. Full classification [2]| Domain | Bacteria |
| Kingdom | Pseudomonadati |
| Phylum | Thermodesulfobacteriota |
| Class | Desulfuromonadia |
| Order | Geobacterales |
| Family | Geobacteraceae |
| Genus | Trichlorobacter |
| Spieces | Trichlorobacter lovleyi |
2 Materials and methods
FASTA and feature table files containing genome information were obtained from the NCBI Genomes Browser (Supplementary Materials 1 and 4).
Files containing genome information for the IAE strain:
| GCF_015239775.1_ASM1523977v1_cds_from_genomic.fna |
| GCF_015239775.1_ASM1523977v1_feature_table.txt |
| GCF_015239775.1_ASM1523977v1_genomic.fna |
Files containing genome information for the SZ strain:
| GCF_000020385.1_ASM2038v1_cds_from_genomic.fna |
| GCF_000020385.1_ASM2038v1_feature_table.txt |
| GCF_000020385.1_ASM2038v1_feature_table.txt |
Analysis of the lengths of proteins and other genomic features encoded in the Trichlorobacter lovleyi genome was performed using Google Sheets. The feature table files were imported into Google Sheets (see Supplementary Materials 2, 3, and 5). Tables 2 and 3 were generated using column filters for feature type and class.
For Figures 1, 2, and 3, we constructed tables containing the required genes, proteins, and intergenic distances, and then created histograms using different protein-length ranges. For these analyses, we used the following functions: =COUNTIF, =COUNTIFS, =MAX, =MIN, =AVERAGE, and =MEDIAN.
For Tables 5 and 6, FASTA files with nucleotide sequences were downloaded and analyzed using Python code in Google Colab (Supplementary Materials 6).
3 Results
As a result of the data analysis, numerous figures were generated that allow visualization of specific genomic features and support several conclusions.
3.1 Analysis of length of proteins
Based on the information from the feature table file, a histogram was generated (Figure 1).
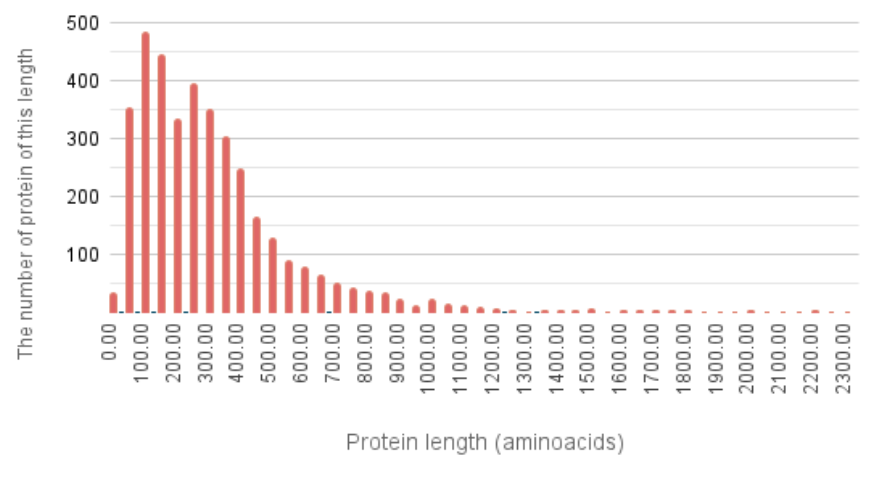
Analyzing the histogram data, we can see that the shortest protein is 25 amino acids long, while the longest reaches 2301 amino acids. The median protein length is 276 amino acids, which is slightly higher than the average median value reported for bacteria (267 amino acids) [5] . Based on the table data, the average protein length in Trichlorobacter lovleyi was also calculated to be 327 amino acids, which is close to the typical average protein length in bacteria (≈314 amino acids) [6] .
3.2 Analysis of molecules encoded in replicones
In the course of the review, we examined the content of sequences encoding different types of RNA as well as the number of proteins. All analyzed data are presented in Table 2.
Table 2. Number of proteins and different RNA types per replicon. tRNA is the transfer RNA, tm is the transfer-message RNA, SRP is the signal recognition particle RNA, RNase_P is the ribonuclease P, nc is the non-coding RNA
| Replicon | Protein | tRNA | tmRNA | SRP | RNase_P | nc |
|---|---|---|---|---|---|---|
| chr | 3365 | 47 | 1 | 1 | 1 | 1 |
| pIAE1 | 321 | 23 | 0 | 0 | 0 | 0 |
According to the table data, the second replicon contains genes encoding a greater variety of RNA types than the IAE1 plasmid replicon. It can also be observed that the second replicon is larger than the first. This suggests that the first replicon corresponds to the plasmid, while the second replicon represents the nucleoid chromosome.
3.3 Comparing genomes of SZ and IAE strains
SZ strain can use radionuclides as an electron acceptors but IAE strain can not . So we decided to study and compare genomes of these strains.
3.3.1 Analysis of SZ strain
First, we analyzed the replicons of this strain and compiled all data into Table 3.
Table 3. Number of proteins and different RNA types per replicon in SZ strain.
| Replicon | Protein | tRNA | tmRNA | SRP | RNase_P | nc |
|---|---|---|---|---|---|---|
| chr | 3586 | 44 | 1 | 1 | 1 | 1 |
| pGLOV1 | 79 | 0 | 0 | 0 | 0 | 0 |
We can see that the plasmid of the SZ strain does not contain any RNA genes and harbors 79 protein-coding genes.
3.3.2 Comparing plasmids of IAE and SZ strains
As shown earlier in the tables, the strains share many similarities in terms of their chromosomes. However, the IAE strain has a chromosome that encodes more proteins and tRNAs (47 tRNAs for IAE versus 44 for SZ). Remarkably, these strains possess completely different plasmids; therefore, the next step is to analyze the plasmids (Table 4)
Table 4. Comparing of plasmids of IAE and SZ strains
| Type | pGLOV1 | pIAE1 |
|---|---|---|
| Protein | 79 | 321 |
| Transport RNA (tRNA) | 0 | 23 |
pGLOV1 is a plasmid from the SZ strain and pIAE1 is a plasmid from the IAE strain.
The longest protein is 1,588 amino acids in length, while the shortest is 28 amino acids. The median protein length is 179 amino acids.
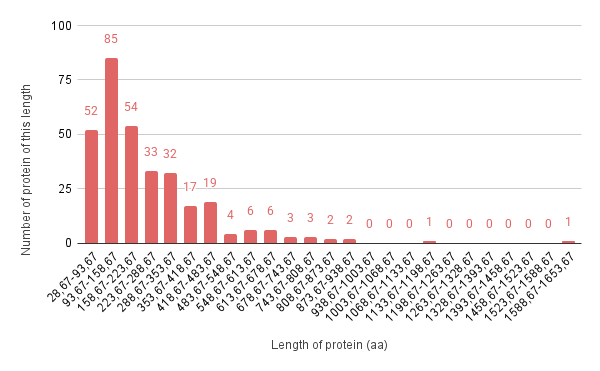
The longest protein is 1,312 amino acids in length, while the shortest is 52 amino acids. The median protein length is 233 amino acids.
We calculated the average protein length for each strain, which are 244 and 288 amino acids, respectively. Thus, the pGLOV1 plasmid encodes fewer proteins, but these proteins are larger than those encoded by the pIAE1 plasmid. This suggests that these plasmids may influence the metabolism of Trichlorobacter lovleyi.
3.3.3 Nucleotide composition
We counted the occurrences of each nucleotide type from the FASTA files for each strain.
Table 5. Number of every type of nucleotide in Trichlorobacter lovleyi (SZ strain)
| Nucleotide | Count | Percentage |
|---|---|---|
| A | 9412 | 25.04% |
| T | 9144 | 24.33% |
| G | 9519 | 25.32% |
| C | 9366 | 24.92% |
As shown in Table 5, the percentage of each nucleotide type is identical, with GC content at 50.24%. Therefore, the DNA forms fewer triple hydrogen bonds.
Table 6. Number of every type of nucleotide in Trichlorobacter lovleyi (IAE strain)
| Nucleotide | Count | Percentage |
|---|---|---|
| A | 9668 | 25.75% |
| T | 9718 | 25.88% |
| G | 8975 | 23.90% |
| C | 9024 | 24.03% |
As shown in Table 6, the percentage of each nucleotide type is identical, with a GC content of 47.93%.
We can conclude that both strains are not adapted to high temperatures, which is consistent with the fact that this bacterium inhabits creek sediment.
3.3.4 Conclusion
As a result of this study, it is evident that the IAE and SZ strains exhibit significant differences in their genomes. For example, they possess completely different plasmids: the IAE plasmid is three times larger than that of the SZ strain and contains genes for 23 tRNAs. This suggests that these plasmids may encode different metabolic proteins. Subsequent analyses should include a more detailed investigation of the proteins and their characteristics, with particular attention to those encoded by the plasmids. Additionally, the reasons for the pronounced difference in RNA content between the plasmids should be explored.
4 References
- 1. Sung Y, Fletcher KE, Ritalahti KM, Apkarian RP, Ramos-Hernández N, Sanford RA, Mesbah NM, Löffler FE. Geobacter lovleyi sp. nov. strain SZ, a novel metal-reducing and tetrachloroethene-dechlorinating bacterium. Appl Environ Microbiol. 2006 Apr;72(4):2775-82. doi: 10.1128/AEM.72.4.2775-2782.2006. PMID: 16597982; PMCID: PMC1448980.
- 2. Taxonomy browser - NCBI - NLM https://www.ncbi.nlm.nih.gov/datasets/taxonomy/tree/?taxon=313985
- 3. Jin H, Li X, Wang J, Cui Y, Huang S, Shi K, Zhou T, Yan Draft genomes of Dehalococcoides mccartyi strain J1 and Trichlorobacter lovleyi strain J2 from a tetrachloroethene-dechlorinating consortium | Microbiology Resource Announcements J.2025.14:e00485-25.
- 4. Marcela Tabares, Kazem Kashefi, Gemma Reguera, Adaptive responses of Trichlorobacter lovleyi to nitrite detoxification reveal overlooked contributions of Geobacterales to nitrate ammonification, The ISME Journal, Volume 19, Issue 1, January 2025, wraf054, https://doi.org/10.1093/ismejo/wraf054
- 5. Luciano Brocchieri, Samuel Karlin, Protein length in eukaryotic and prokaryotic proteomes, Nucleic Acids Research, Volume 33, Issue 10, 1 June 2005, Pages 3390–3400, Protein length in eukaryotic and prokaryotic proteomes | Nucleic Acids Research | Oxford Academic
- 6. Hatton L., Warr G. Protein structure and evolution: are they constrained globally by a principle derived from information theory? //PLoS One. – 2015. – Т. 10. – №. 5. – С. e0125663