Pyrococcus chitonophagus – is an anaerobic hyperthermophilic archaeon with an interesting chitinolytic system. In this mini-review, some genome and proteome parameters have been analyzed. Replication origin and terminus position have been predicted using a cumulative GC skew method. The frequencies of codons have been calculated. Strange 8-nucleotide sequences that can not be found in the complete genome have been revealed. Protein length distribution has been analyzed by descriptive statistics methods. Finally, the number of proteins in + and - DNA strands and in leading and lagging “semirings” have been calculated and compared, the statistical significance of observed differences have been analyzed.
Keywords: Pyrococcus chitonophagus, Hyperthermophilic archaeon, genome analysis, proteome analysis
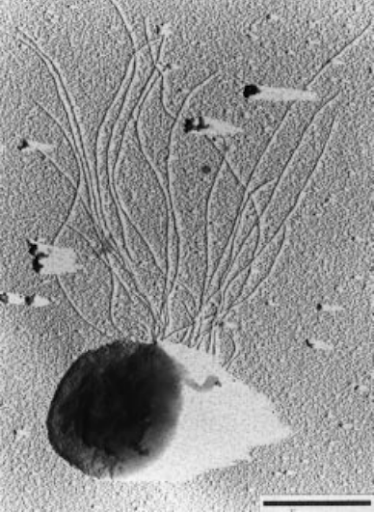
As Huber et al. (1995) described, Pyrococcus chitonophagus – is an anaerobic hyperthermophilic archaeon with a coccoid shape and diameter of about 1,2 – 2,5 µm. It has a tuft of flagella and, thus, is motile (Fig. 1) (Huber et al., 1995). The archaeon was indicated as a species of the genus Thermococcus by 16S rRNA sequencing (Huber et al., 1995), but whole genome analysis has revealed that it should be related to the genus Pyrococcus actually (Papadimitriou et al., 2016).
Pyrococcus chitonophagus mainly attracts scientists with its chitinolytic system. There are several other archaea that can degrade chitin too, but Pyrococcus chitonophagus is one of only three archaea that can use it as the sole energy and carbon source (Antranikian et al., 2005). The archaeon contains multiple chitinases: an extracellular exochitinase (Chi50), a periplasmic chitobiase (Chi90), and a cell-membrane-anchored endochitinase (Chi70) (Andronopoulou et al., 2004). The described chitinolytic system lets Pyrococcus chitonophagus efficiently degrade chitin (Horiuchi et al., 2016) and make it an interesting object for further investigation.
The cumulative GC skew method has been used to predict the position of replication origin and terminus. Minimum and maximum cumulative GC skew have been analyzed using two independent programs:
GC skew has been calculated using the following formula:
GC skew = (G - C) / (G + C)
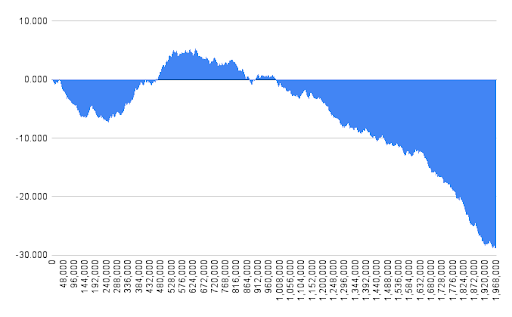
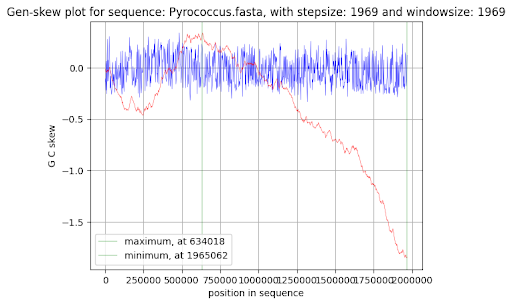
In my Python program window and step of 1500 nucleotides have been selected. In Genskew online version window and step have been selected automatically on the level of 1969 nucleotides. Cumulative GC skew has been calculated as the sum of GC skew in previous and current intervals. Cumulative GC skew can be represented mathematically as the integral value of GC skew function from point 0 to current nucleotide point. Fig. 2 has been generated using Google Sheets and the output of my Python program. Fig. 3 has been generated automatically by Genskew.
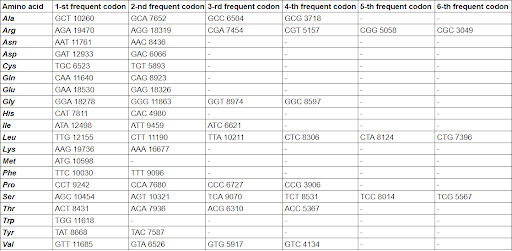
My Python program has been used to analyze the frequency of codons, which encode amino acids (Supplementary Materials 3). The result has been represented as a table, using Google Sheets (Table 1). Stop-codons have not been counted by the program. All codons of each amino acid have been sorted by frequency manually.
Table 1 Codon usage analysis results.
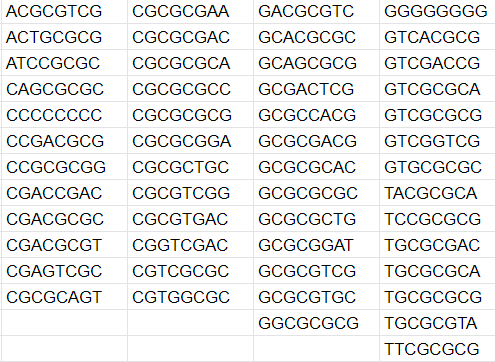
My Python program (Supplementary Materials 3) has been used to find sequences that can not be found in Pyrococcus chitonophagus complete genome. + and - strands have been analyzed in only 5’- 3’direction. The probability of observed result (51 8-nucleotide sequences can not be found) has been calculated as:
(1 - 0,25^8 * 51)^1969640 * (number of 51-combinations from 65536),
where 65536 = 4^8 and 1969640 = genome length - 8
The number of combinations has been estimated as 65536^51 / 51!
The table of genome features of Pyrococcus chitonophagus (Supplementary Materials 1) has been imported to Google Sheets (CDS sheet). A column of intervals has been created with a window of 30 amino acids. Then the amount of proteins with length in each interval has been calculated, using a COUNTIFS Google Sheets function.
For example, the following formula counts proteins with length from a value in A3 to value in A4:
=COUNTIFS(CDS!H:H,">="&A3,CDS!H:H,"<"&A4)
The protein length column is H in the CDS sheet.
This data has been used to create a protein length histogram (Fig. 4).
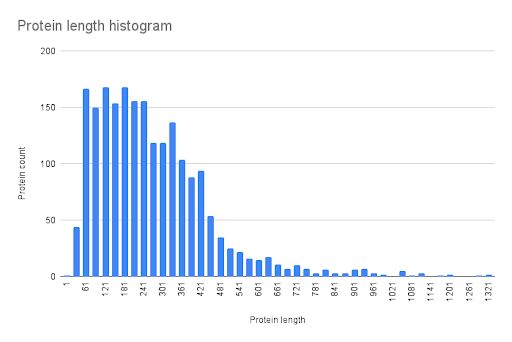
Google Sheets functions AVERAGE, STDEV.P, PERCENTILE.INC (with parameters 0,25; 0,75; 0,5), MIN, and MAX have been used to calculate mean, standard deviation, 25th and 75th percentiles, median (50th percentile), minimum value, and maximum value respectively.
The number of proteins in + and - strands has been calculated using the COUNTIF Google Sheets function. For example, the following formula has been used to calculate the number of proteins in + strand:
=COUNTIF(CDS!E:E,"+")
The strand column is E in the CDS sheet.
The probability of observed distribution has been calculated using binomial distribution:
=2*BINOM.DIST(MIN(A2,B2),A2+B2,0.5,TRUE)
A2 and B2 contain numbers of protein in + and - strands. The result has been multiplied to 2 because we don’t choose initially the strand, which should contain more proteins.
The chromosome of Pyrococcus chitonophagus is circular, so the term “semiring” can be introduced with meaning “the half of a chromosome when one of the cuts is in the origin position”. The number of proteins in leading and lagging “semirings” has been calculated, using an origin position and a “semiring” length data. For example, the following formula has been used to calculate the number of proteins in leading “semiring” of - strand:
=COUNTIFS(CDS!E:E,"-",CDS!C:C,">="&G9,CDS!C:C,"<"&G9+H9)
G9 contains the origin replication position (248297) and H9 contains the length of “semiring” (984824). The number of proteins in lagging “semiring” of - strand has been calculated by subtraction of the number of proteins in leading “semiring” from the total number of proteins in - strand. + strand has been analyzed in the same way.
To predict the replication origin and terminus position a method described by Grigoriev A. (1998) - cumulative GC skew plot has been used.
Cumulative GC skew plots for Pyrococcus chitonophagus are represented in Fig. 2 and Fig. 3. The output of the Python program, which has been used to create the cumulative GC skew plot (Fig. 2), can be found in Supplementary Materials 4.
Replication origin position has been calculated as 246000 nucleotides by my Python program and nearly 250000 nucleotides by Genskew. It should be noticed that minimum is not at the end of the sequence, because the chromosome of Pyrococcus chitonophagus is circular, and the downward trend continues after zero point.
Replication terminus position has been calculated as 634500 nucleotides by my Python program and 634000 nucleotides by Genskew.
The result of origin prediction is almost the same as the result described in Papadimitriou K et. al. article (2016). It is proof of the accuracy of my Python and Genskew programs, so the results of the terminus prediction are approved. To the best of my knowledge, it is the first Pyrococcus chitonophagus replication terminus prediction in scientific literature.
The result of the codon usage analysis for each amino acid is represented in Table 1. The numbers in table cells indicate how many times codon has been found. It has been revealed that codons are not used with the same probability in Pyrococcus chitonophagus. It is consistent with the synonymous codon usage bias conception (Ermolaeva MD et al., 2001).
I think, codon usage table, represented in this mini-review, can be helpful for the expression of genes from Pyrococcus chitonophagus (f. e. chitinase) in other organisms. It has been reported that codon usage bias affects the efficient expression of genes (Yu CH et al., 2015) so the evaluation of Pyrococcus chitonophagus codon usage can help to find the best organism for gene expression.
Fifty-one 8-nucleotide sequences can not be found in the Pyrococcus chitonophagus genome (Fig. 5). It is interesting because the probability of this event happening accidentally is extremely small. The dominance of CG-rich sequences can be explained by Pyrococcus chitonophagus CG content (44.92 %), but I do not know how to explain why these sequences can not be found. Additionally, similar results can be observed with E. coli (Fig. 6). All 7-nucleotide sequences can be found in both organisms.
The histogram of protein length distribution is represented in Fig. 4. Some statistical parameters of protein length distribution are represented in Table 2. The mean value of protein length is 282,9, which is very similar to the value of 283 amino acids, calculated for archaeal proteins (Tiessen A et al., 2012). The median value of protein length is 249, which is similar to the value of 237 amino acids, calculated for archaeal proteins (Tiessen A et al., 2012). In conclusion, the protein length distribution of Pyrococcus chitonophagus is common for Archaea.

The number of proteins in + and - strands is represented in Table 3.
The probability of this distribution is calculated as 0,0000013, which is less than 0,05. Thus, it is a statistically significant difference. The number of proteins in leading and lagging “semirings” is represented in Table 4. The probability of distribution in the + strand is calculated as 0,13, which is statistically insignificant. The probability of distribution in - strand is calculated as 0.000000015, which is statistically significant. The results are consistent with the fact that lagging strand DNA replication is significantly more accurate (Maslowska KH et al., 2018). In other words, “it is better” to place proteins in place with high-accuracy replication.
Table 2 Descriptive statistic parameters of protein length distribution.
| Mean | 282.9 |
| Standard deviation | 185.9 |
| 25th percentile | 150 |
| Median (50th percentile) | 249 |
| 75th percentile | 371 |
| Minimal protein length | 26 |
| Maximal protein length | 1926 |
Table 3 The number of proteins in + and - strands.
| strand | strand |
|---|---|
| 935 | 1157 |
Table 4 The number of proteins in leading and lagging “semirings”.
| + strand | - strand | ||
|---|---|---|---|
| Leading “semiring” | Lagging “semiring” | Leading “semiring” | Lagging “semiring” |
| 444 | 491 | 482 | 657 |
Replication origin position has been predicted to be at 246000 - 250000 nucleotides. It is supported by the previous study (Papadimitriou et al., 2016). The replication terminus position has been predicted to be at 634000 - 634500 nucleotides.
Codon usage analysis results (Table 1) can be used for further investigations.
Strange 8-nucleotide sequences that can not be found in the complete genome have been revealed. The mean and the median values of protein length are 282,9 and 249 amino acids respectively. It is close to other archaeal proteomes (Tiessen A et al., 2012). Statistically significant protein distribution inequality in + and - strands and in the leading and lagging “semirings” of a - strand has been revealed. The result is consistent with replication accuracy inequality (Maslowska KH et al., 2018). The results of the presented mini-review can be useful for further Pyrococcus chitonophagus genome and proteome investigations.
I thank my parents and classmates for their encouragement and support.
The author declares no conflict of interest.
Andrianopoulou E, Vorgias CE. Multiple components and induction mechanism of the chitinolytic system of the hyperthermophilic archaeon Thermococcus chitonophagus. Appl Microbiol Biotechnol. 2004 Nov;65(6):694-702. doi: 10.1007/s00253-004-1640-4. Epub 2004 Aug 21. PMID: 15322771.
Antranikian G, Vorgias CE, Bertoldo C. Extreme environments as a resource for microorganisms and novel biocatalysts. Adv Biochem Eng Biotechnol. 2005;96:219-62. doi: 10.1007/b135786. PMID: 16566093.
Ermolaeva MD. Synonymous codon usage in bacteria. Curr Issues Mol Biol. 2001 Oct;3(4):91-7. PMID: 11719972.
Grigoriev A. Analyzing genomes with cumulative skew diagrams. Nucleic Acids Res. 1998 May 15;26(10):2286-90. doi: 10.1093/nar/26.10.2286. PMID: 9580676; PMCID: PMC147580.
Horiuchi A et al. A Structurally Novel Chitinase from the Chitin-Degrading Hyperthermophilic Archaeon Thermococcus chitonophagus. Appl Environ Microbiol. 2016 May 31;82(12):3554-3562. doi: 10.1128/AEM.00319-16. PMID: 27060120; PMCID: PMC4959179.
Huber, R., Stöhr, J., Hohenhaus, S. et al. Thermococcus chitonophagus sp. nov., a novel, chitin-degrading, hyperthermophilic archaeum from a deep-sea hydrothermal vent environment. Arch. Microbiol. 164, 255–264 (1995). https://doi.org/10.1007/BF02529959
Maslowska KH et al. High-accuracy lagging-strand DNA replication mediated by DNA polymerase dissociation. Proc Natl Acad Sci U S A. 2018 Apr 17;115(16):4212-4217. doi: 10.1073/pnas.1720353115. Epub 2018 Apr 2. PMID: 29610333; PMCID: PMC5910852.
Papadimitriou K et al. Analysis of the complete genome sequence of the archaeon Pyrococcus chitonophagus DSM 10152 (formerly Thermococcus chitonophagus). Extremophiles. 2016 May;20(3):351-61. doi: 10.1007/s00792-016-0826-x. Epub 2016 Mar 25. PMID: 27016195.
Tiessen A et al. Mathematical modeling and comparison of protein size distribution in different plant, animal, fungal and microbial species reveals a negative correlation between protein size and protein number, thus providing insight into the evolution of proteomes. BMC Res Notes. 2012 Feb 1;5:85. doi: 10.1186/1756-0500-5-85. PMID: 22296664; PMCID: PMC3296660.
Yu CH et al. Codon Usage Influences the Local Rate of Translation Elongation to Regulate Co-translational Protein Folding. Mol Cell. 2015 Sep 3;59(5):744-54. doi: 10.1016/j.molcel.2015.07.018. Epub 2015 Aug 27. PMID: 26321254; PMCID: PMC4561030.