align.pir
1lmp_now.ent
/all//A/SER`32/NE1 - /ligand//A/NAG`138/O6C y
/all//A/GLN`34/N - /ligand//A/NAG`138/O6C  y
/all//A/ASN`46/NE1 - /ligand//A/NAG`138/O1L y

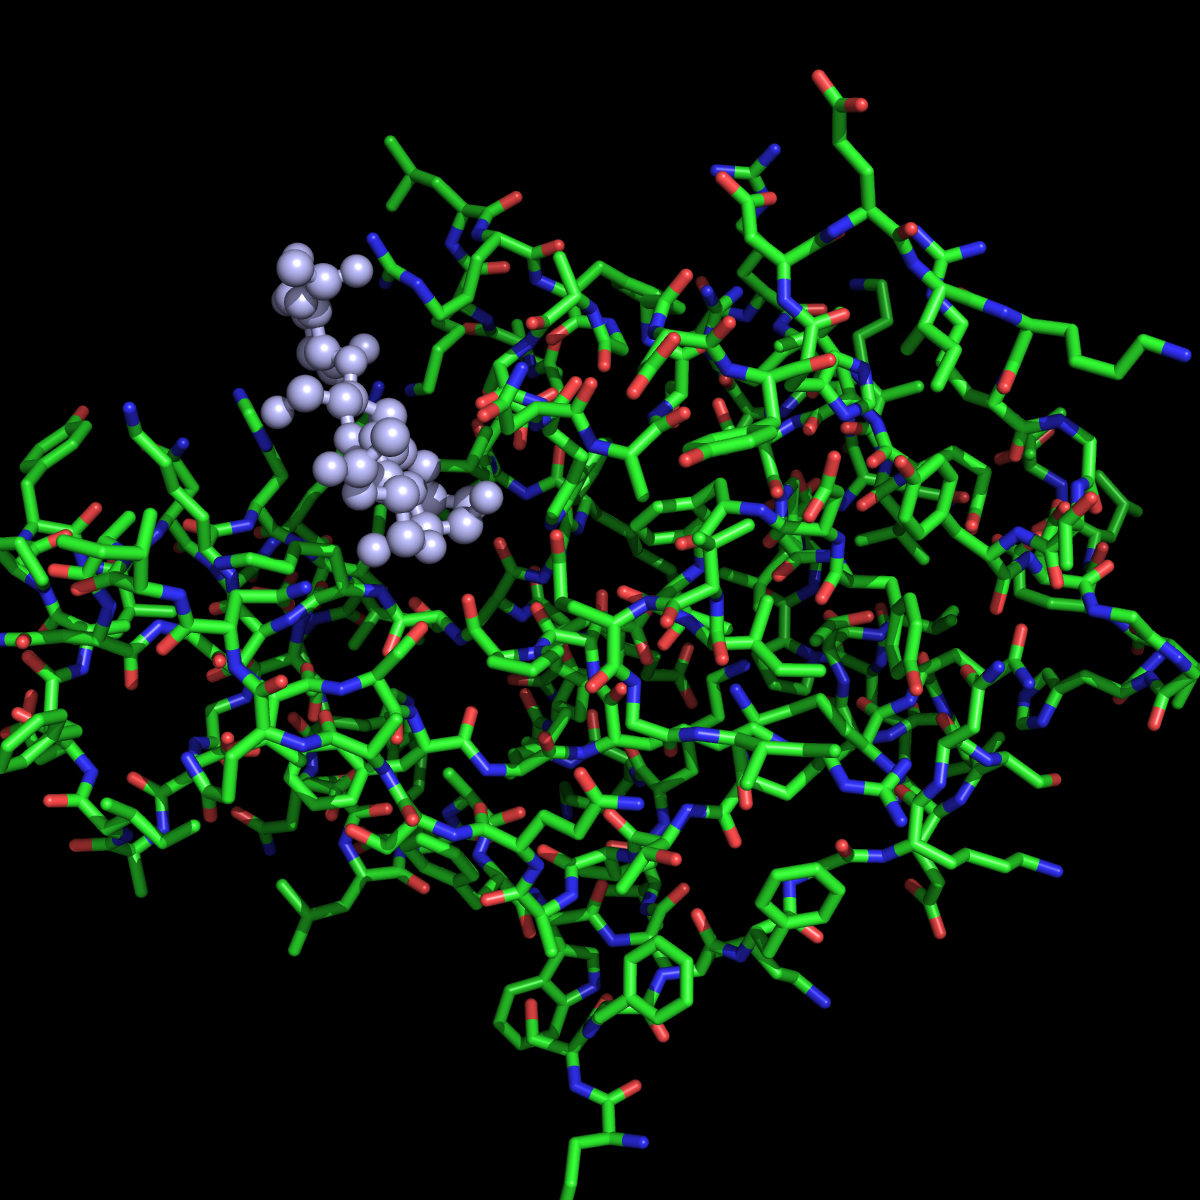
Новые контакты:
/all//A/THR`36/ND2 - /ligand//A/NDG`138/O6C
/all//A/GLN`39/N - /ligand//A/NAG`138/O6C
/all//A/ASN`50/NE1 - /ligand//A/NAG`138/O1L
bpt5.B99990001.pdb
bpt5.B99990002.pdb
bpt5.B99990003.pdb
bpt5.B99990004.pdb
bpt5.B99990005.pdb
№ - Ramachandran plot evaluation - Standard deviation of omega values
1 - (-2.024) - 5.514
2 - (-2.297) - 5.655
3 - (-1.330) - 5.217
4 - (-1.759) - 5.124
5 - (-1.766) - 6.710
i - (-0.977) - 2.708

The Ramachandran plot is probably the very best indicator of the quality of the
experimental determination of three dimesional protein coordinates.
This server analyses the Ramachandran plot of a PDB file and compares it with the
Ramachandran plots of about 400 representative structures solved at high resolution.
The score expressing how well the backbone conformations of all residues
correspond to the known allowed areas in the Ramachandran plot is a bit low.

The omega angles for trans-peptide bonds in a structure is expected to give a
gaussian distribution with the average around +178 degrees, and a standard
deviation around 5.5. In the current structure the standard deviation agrees
with this expectation.

Исходя из полученных оценок, выбираем 3 модель.

