Mini-Review
Genome and proteome analysis of the hyper-thermophilic archaeon Thermococcus eurythermalis
Vladislav A. Nachatoy
Department of Bioengineering and Bioinformatics, Lomonosov Moscow State University, Moscow, Russia.
Abstract. We have analysed the genome and the proteome of the hyper-thermophilic archaeon Thermococcus eurythermalis which was isolated from an oil-immersed hydrothermal chimney at a depth about 2000 meters in the Guaymas Basin and can be used for hydrogen production.
Motivation. Bioinformatic in the first term of study at the MSU Department of Bioengineering and Bioinformatics.
Results. We have calculated DNA length, GC-content and GC-skew, have found oriC and ter; have counted amount of different types of RNA, coding DNA sequences and some of the proteins; have build protein length distribution diagram; have analysed quantity of genes on the chromosome by chains.
Contact. nachatoi@fbb.msu.ru
1. Introduction
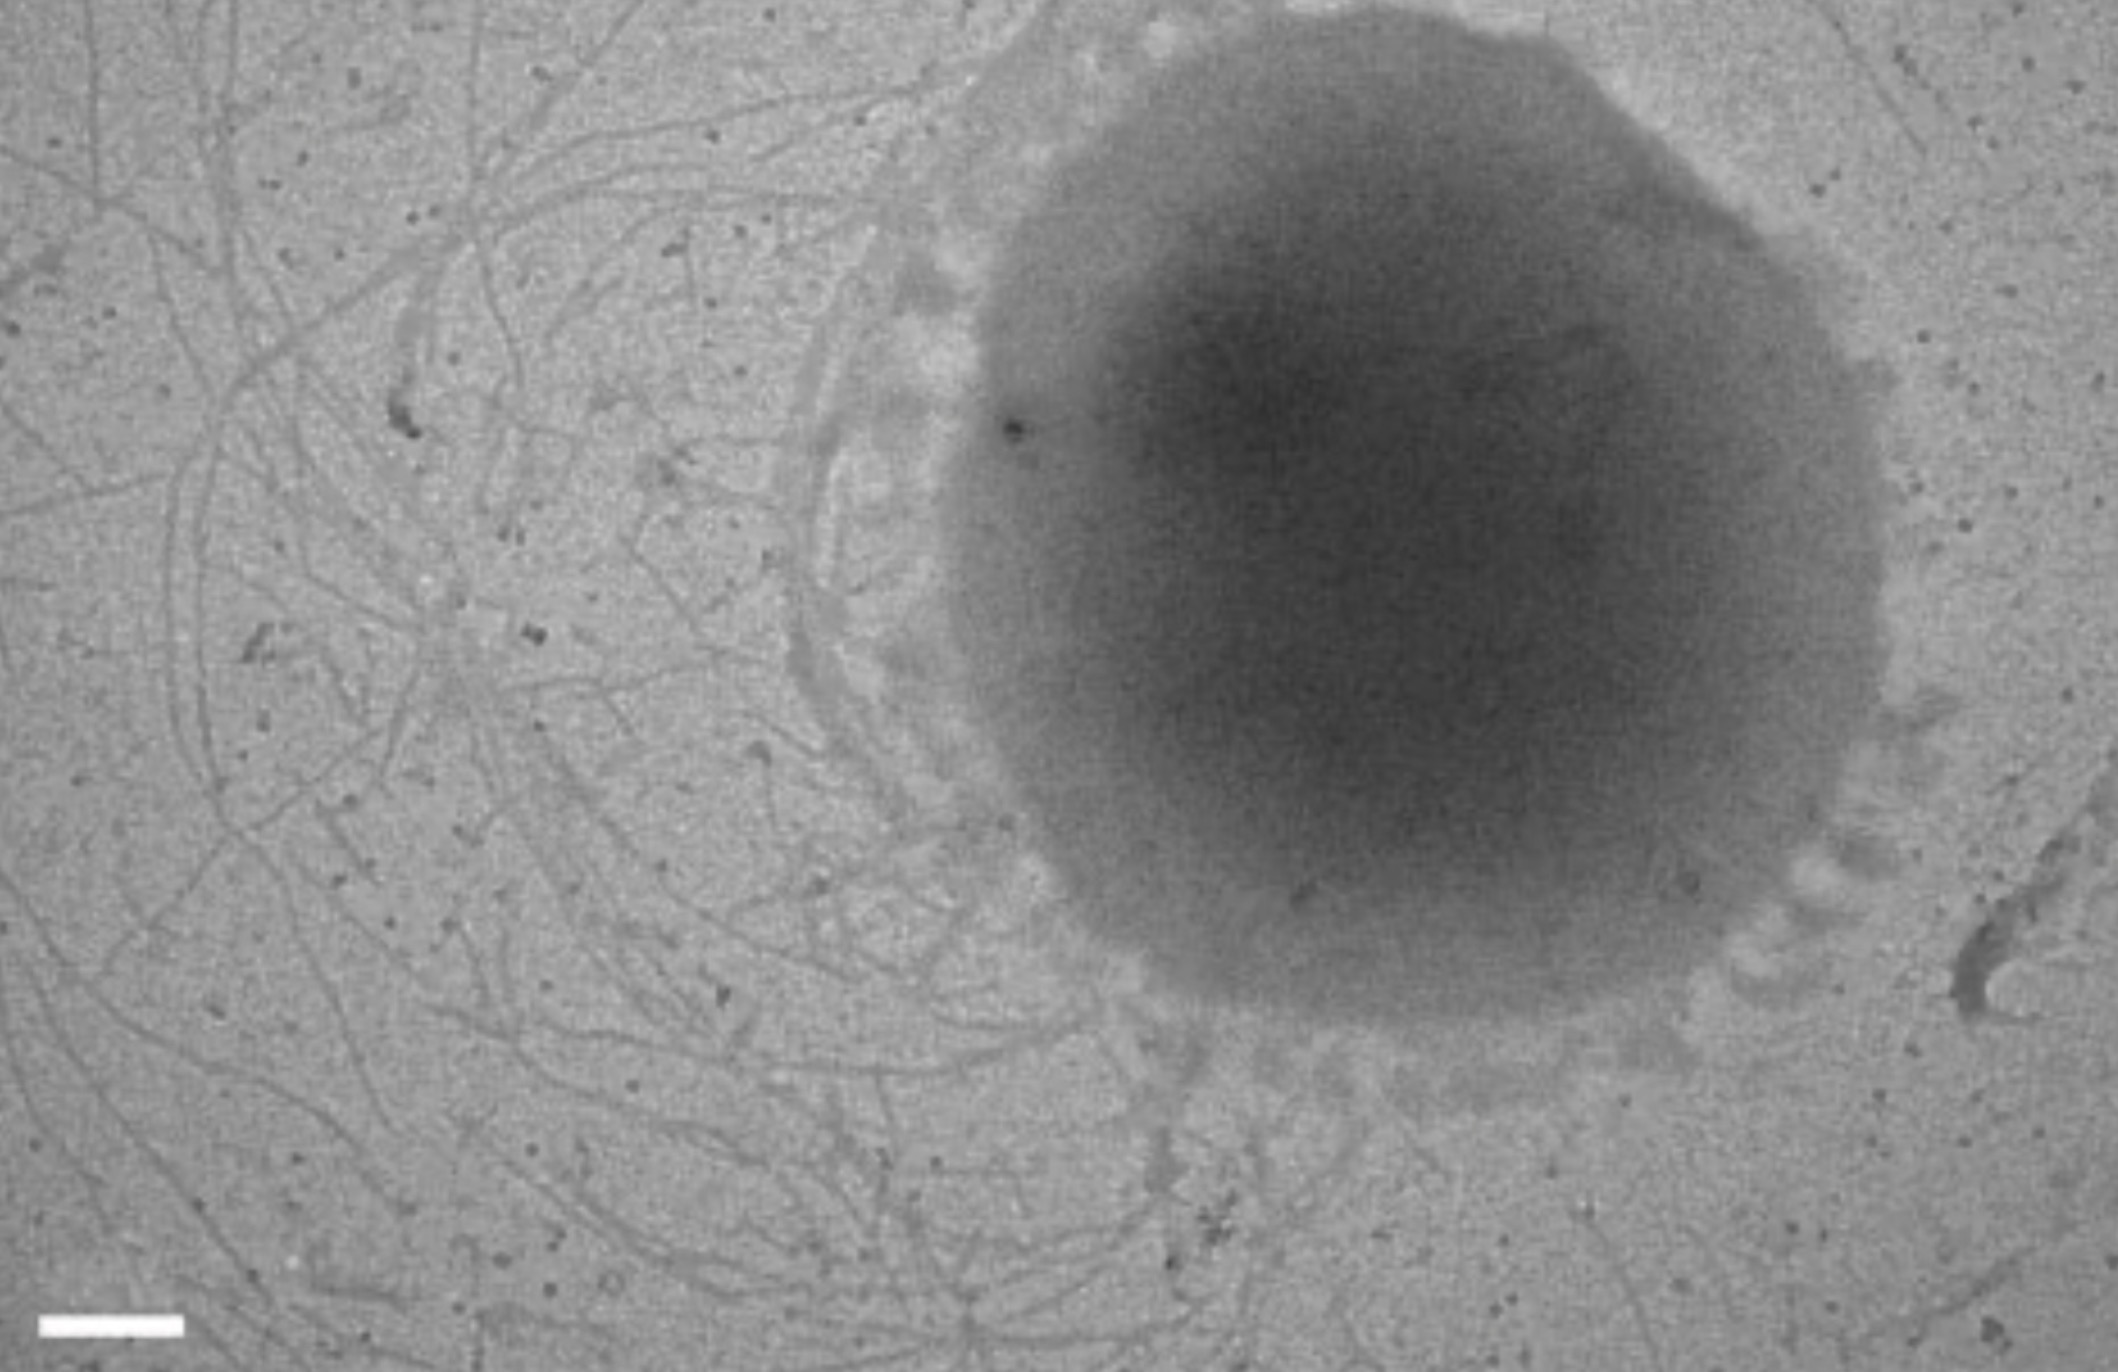
Thermococcus eurythermalis is a hyper-thermophilic archaeon (Fig. 1) with a wide range for growth condition including temperature and pH was isolated from an oil-immersed hydrothermal chimney at a depth about 2000 meters in the Guaymas Basin (Weishu et al., 2015) which is the basin in the Gulf of California. According to the genome sequence analysis in Weishu Z. and Xiang X. (2014) T. eurythermalis encodes a series of hydrogenase complexes, so in Siying et al. (2021) T. eurythermalis A501 was used to study the hydrogen production capacity of dark fermentation.
Cells of the strain A501 are mobile cocci 0.6–2.6 mm in diameter with a tuft of flagella. Growth was observed over the range 50–102 °С at atmospheric pressure, optimal temperature was 85 °С. At this temperature growth was detected at a pressure 0.1–70 MPa, optimum was at 0.1–30 MPa. Also cells of the T. eurythermalis grew at pH 4–9 with the optimal value pH 7.0 and a NaCl concentration of 1–5% (optimum is 2.5% NaCl) (Weishu Z. and Xiang X., 2014).
Thermococcus eurythermalis is an anaerobic chemo-organoheterotroph which was able to utilize yeast extract, peptone, tryptone and starch as the single carbon source. Elemental sulfur and cysteine were not necessary, but stimulated growth (Weishu Z. and Xiang X., 2014).
In this mini-review we analysed the genome and the proteome of Thermococcus eurythermalis to find something interesting which could be useful either for further research or in industry.
2. Methods
2.1. Genome analysis
2.1.1. GC-content and DNA length
Information about DNA length was taken from NCBI database from GCF_000769655.1_ASM76965v1_assembly_stats.txt. Using EMBOSS: 6.6.0.0 package and geecee program from there we calculate the GC-content of the chromosome and plasmid.
2.1.2. Quantitative analysis of the different sequences in DNA including different RNA
The table of genome features of Thermococcus eurythermalis A501 has been imported into Google Sheets (Supplementary Materials S1) on the sheet “GCF_000769655.1_ASM76965v1_feature_table” from NCBI database. Further work will be carried out with some of it’s columns added to the sheet “Analysis” in this table. In the columns “# feature” (only for genes), “class” (only for proteins) and “name” (for others) we find counts of the genes, proteins (all of the proteins, ribosomal proteins, hypothetical proteins) and RNA (all of the RNA, tRNA and rRNA) using function: =IFERROR(IF(FIND("with_protein"; H8) > 0; 1; ""); ""), where H8 is the cell with data about sequence, with_protein is the type of the sequence we want to find. If the contents of the cell match the one we are looking for, the function returns 1, which we sum up for all sequences and get the desired count.
2.1.3. The origin and the terminus of the replication
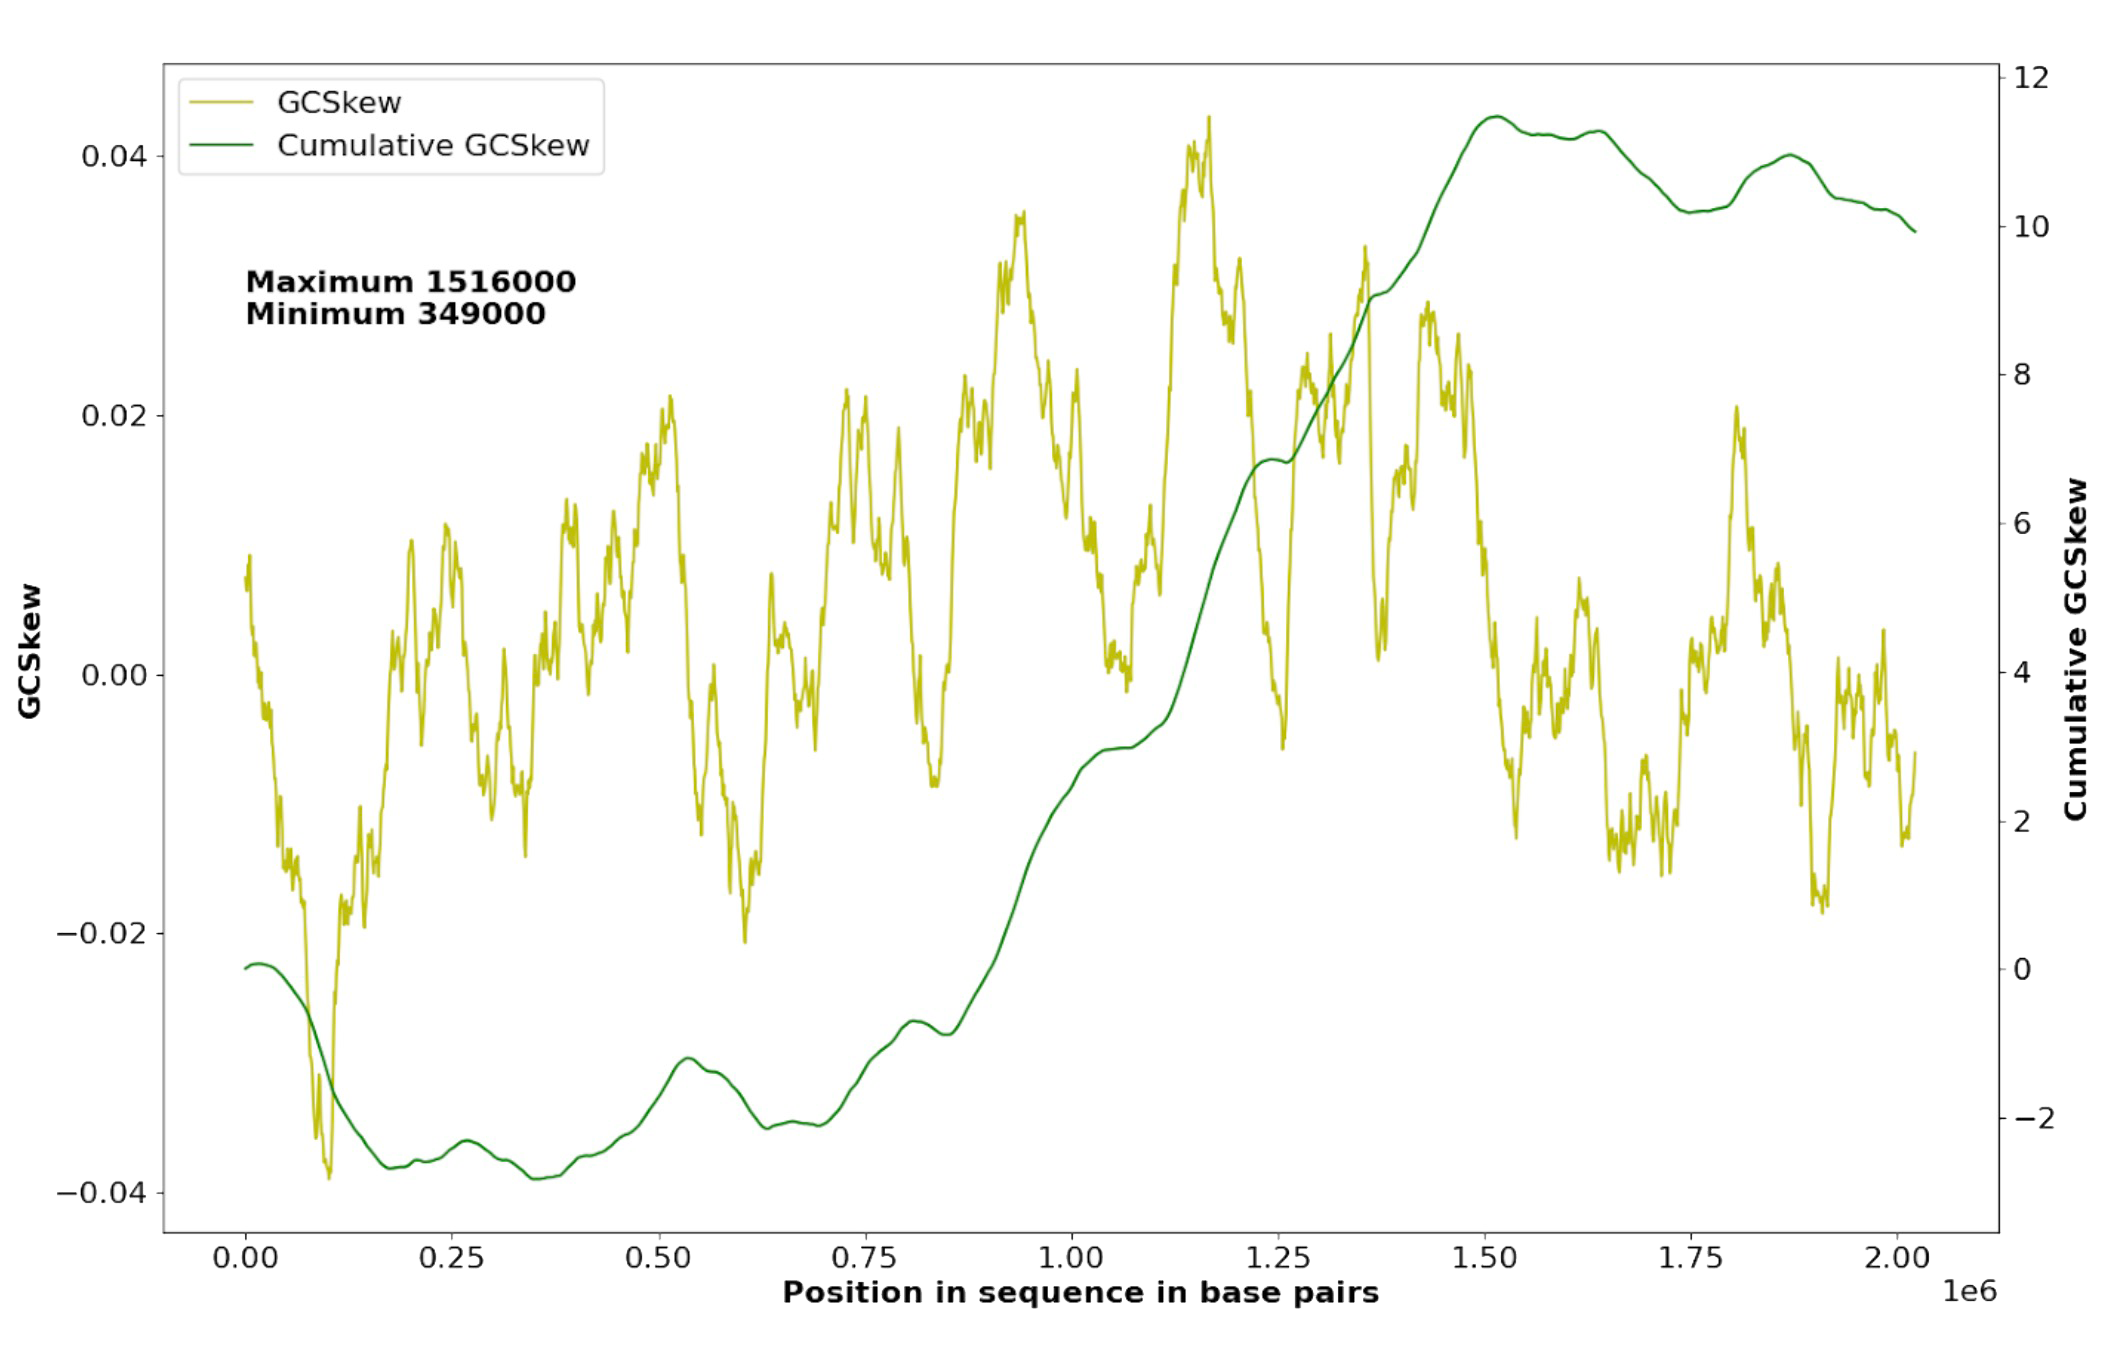
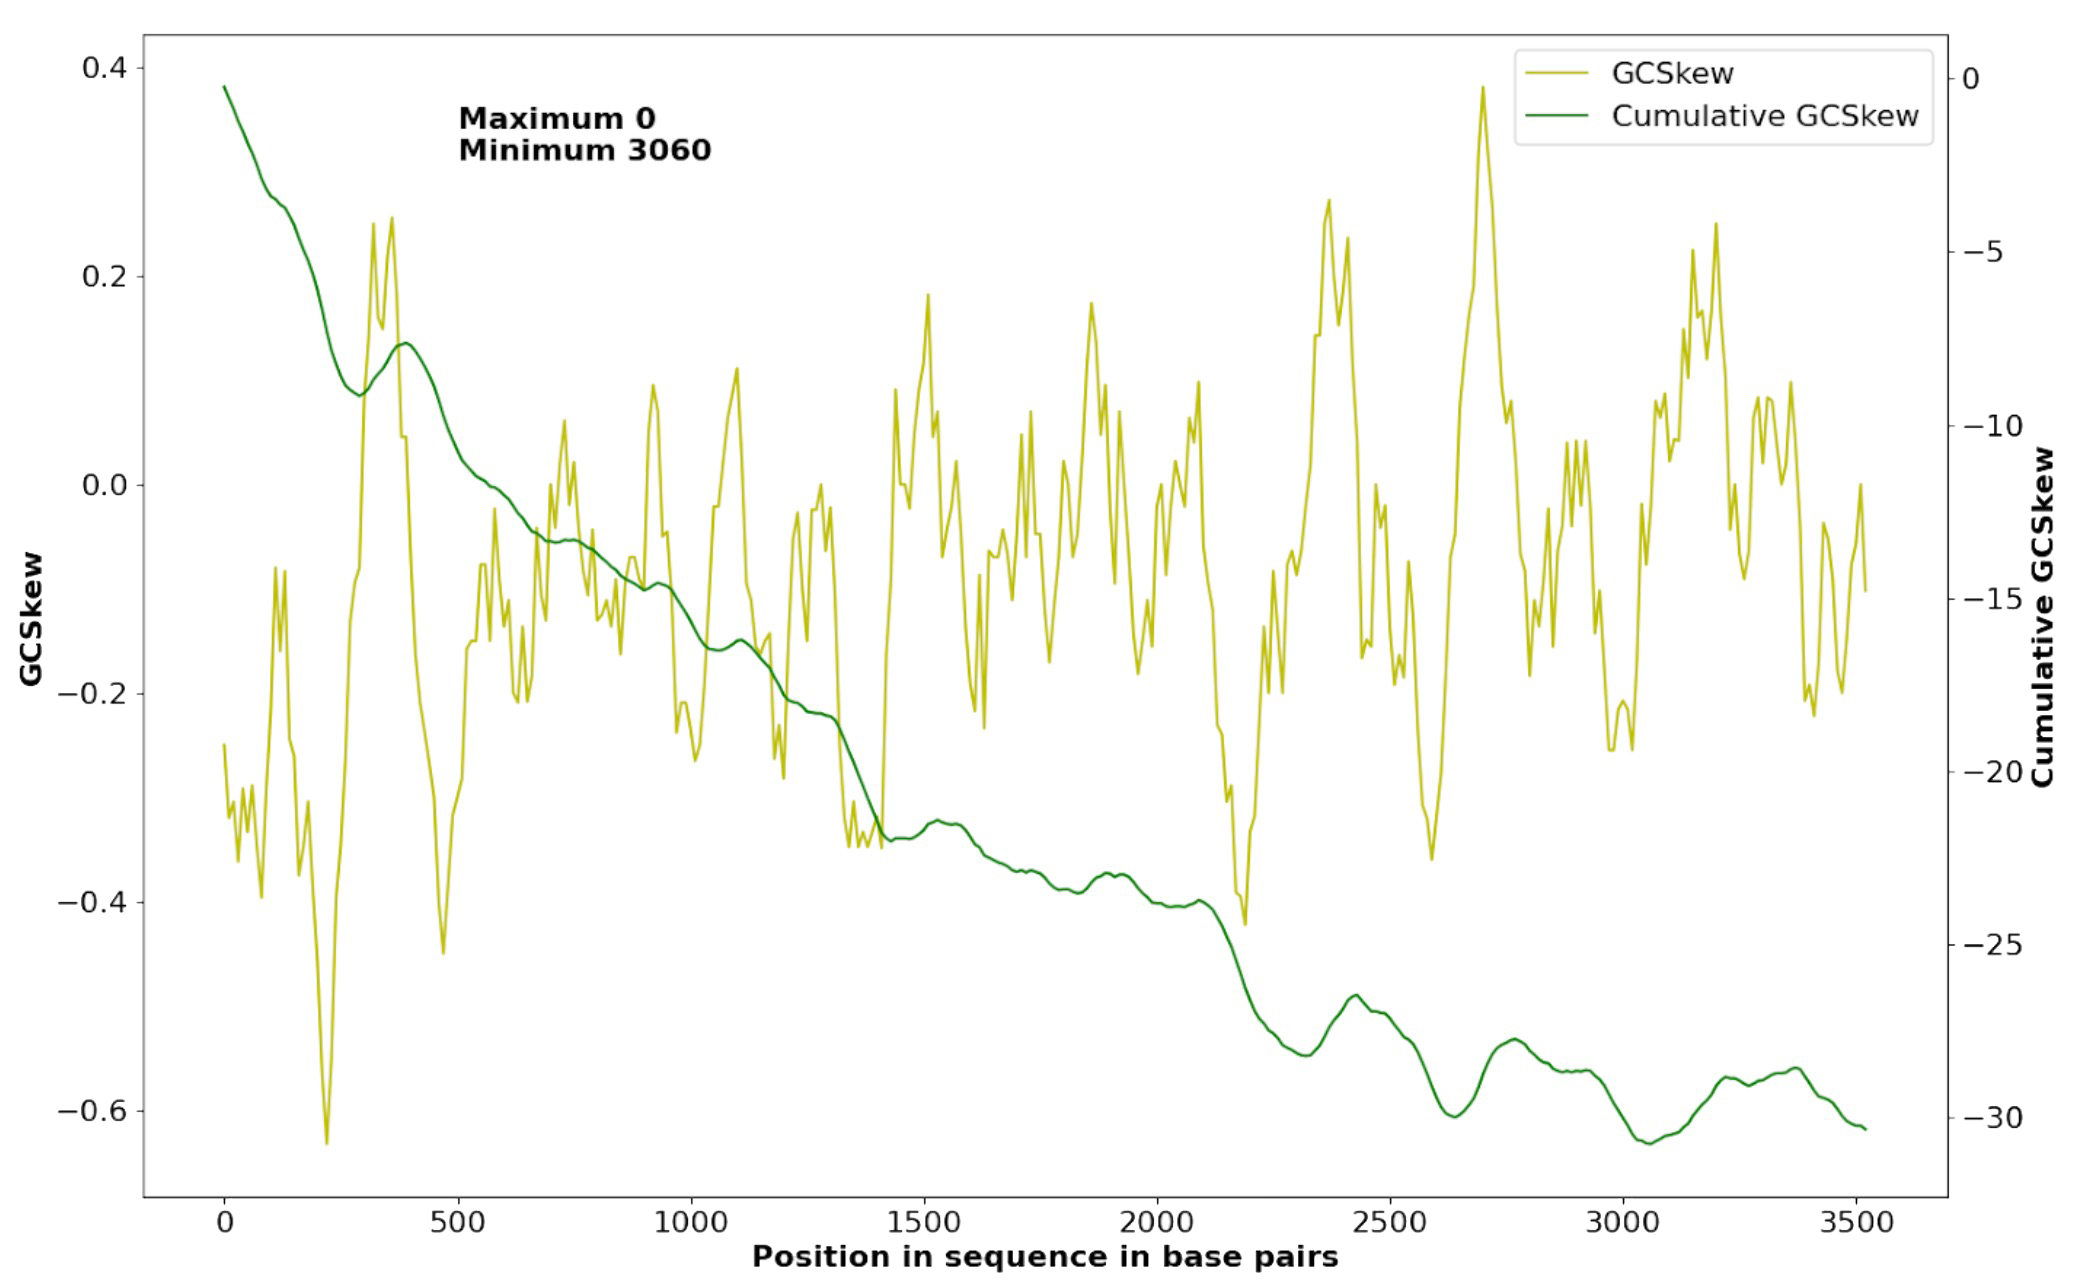
Using formula (G – C)/(G + C), where G is the amount of guanine in the current window of the sequence and C is the amount of cytosine, we count GC-skew for the each window (100 for the plasmid and 100 000 for the chromosome) with a step (10 for the plasmid and 1000 for the chromosome) in the chromosome and plasmid. After that we made a line graph with the coordinates of the windows in the sequence in the horizontal axis, GC-skew for the window in one of the vertical axes and cumulative GC-skew which was considered as the sum of all the previous ones. Cumulative GC-skew needed to find the origin of the replication (the minimum on the vertical axis with the GC-skew) and the terminus (the maximus on the vertical axis with the GC-skew). We use the Python script we wrote to count GC-skew and the cumulative GC-skew (Supplementary Materials S4).
2.1.4. The frequencies of nucleotides on one of the DNA chains
Using another Python script we wrote (Supplementary Materials S5) we count frequencies of nucleotides on one of the DNA chains of Thermococcus eurythermalis chromosome (Supplementary Materials S2).
2.1.5. Quantity of genes on the chromosome by chains
Using Google Sheets (Supplementary Materials S1, sheet “Analysis”) we count the quantity of genes on the “+” and “-” chains to understand whether the genes are randomly distributed between the chains.
2.2. Proteome analysis
2.2.1. Protein length distribution
There are only coding DNA sequences with proteins on the sheet “CDS” in the genome feature table (Supplementary Materials S1). It was imported to the RStudio (version 2022.07.2-576). After that we used ggplot2 package (version 3.3.5) and the methods geom_histogram() with binwidth 16 and geom_boxplot() with the length of the whiskers as 1.58*IQR (interquartile range) which gives a roughly 95% confidence interval for comparing medians (McGill et al., 1978) to make protein length distribution histogram (Fig. 2) and box plot with some of the statistical parameters (Fig. 3): minimum and maximum, 25th, 50th (median) and 75th percentiles, standard deviation and arithmetic mean.
3. Results and discuccion
3.1. Genome analysis
3.1.1. GC-content and DNA length
In the chromosome GC-content is 53%, total length is 2,126,164. In plasmid GC-content is 47%, total length is 3,629.
3.1.2. Quantitative analysis of the different sequences in DNA including different RNA
Count of genes in Thermococcus eurythermalis genome is 2326:
- 2,235 protein coding genes.
- 54 RNA coding genes (46 of them are tRNA coding and 5 are rRNA coding), so protein coding sequences 41.389 times more than RNA coding sequences.
- 562 hypothetical proteins, whose function is unknown — it’s 25.15% of the all proteins.
- The composition of the ribosome includes 65 ribosomal proteins and 5 rRNA.
- 154 transport proteins (6.9% of the total number of proteins).
3.1.3. The origin and the terminus of the replication
We have calculated the minimum and maximum of the cumulative GC-skew in the plasmid (Supplementary Materials S3) and chromosome (Supplementary Materials S2) to find the origin and the terminus of the replication:
- In the chromosome (Fig. 2) replication starts at nearly 1,516,000 bp (oriC) and terminates at nearly 349,000 bp (ter).
- In the plasmid (Fig. 3) replication starts at nearly 3,060 bp (oriC) and terminates at nearly 0 bp (ter).
3.1.4. The frequencies of nucleotides on one of the DNA chains
We count the frequencies of nucleotides on one of the DNA chains: there are only adenine, thymine, guanine and cytosine.
- Adenine: 495,408;
- Thymine: 492,301;
- Guanine: 570,059;
- Cytosine: 564,767.
So we can see that the second Chargaff’s rule (rule holds that for each of the two DNA strands percent of adenine approximately equal to thymine’s percent; similarly for the percentages of guanine and cytosine) performed for Thermococcus eurythermalis.
3.1.5. Quantity of genes on the chromosome by chains
There are 1,270 genes on the “+” chain and 1,051 genes on the “-” chain, p-value is 5.95 × 10⁻⁶ which is less than 0.05 so we can conclude that the genes between the chains are distributed randomly.
3.2. Proteome analysis
3.2.1. Protein length distribution
The histogram of protein length distribution is represented in Fig. 4. The arithmetic mean is 285 which is very similar to the value of 283 amino acids calculated for archaeal proteins (Tiessen et al., 2012). Median is 243 amino acids. In conclusion, the protein length of Thermococcus eurythermalis is common to the values for the archaea.
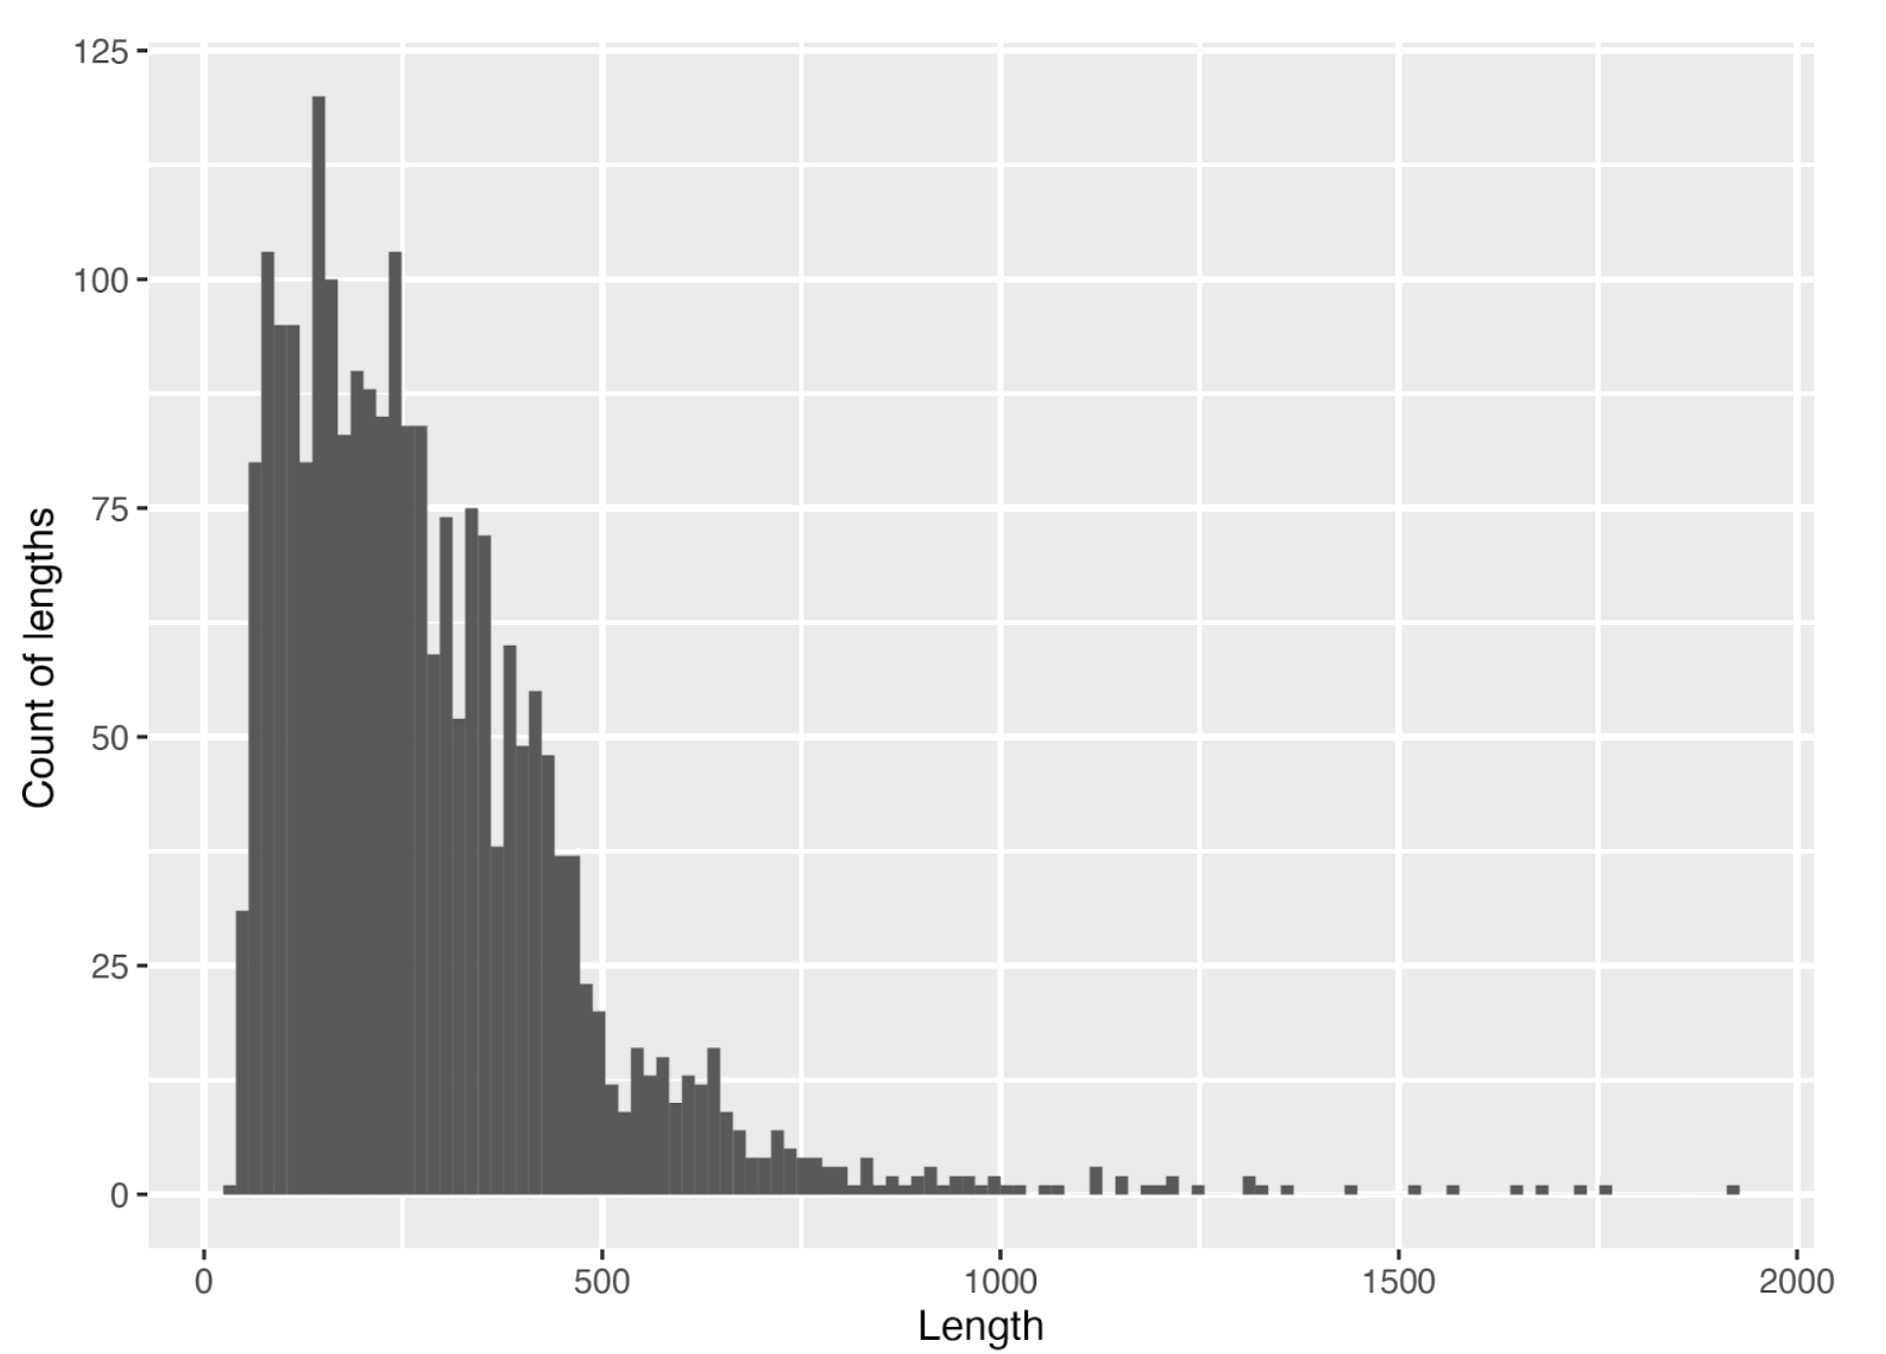
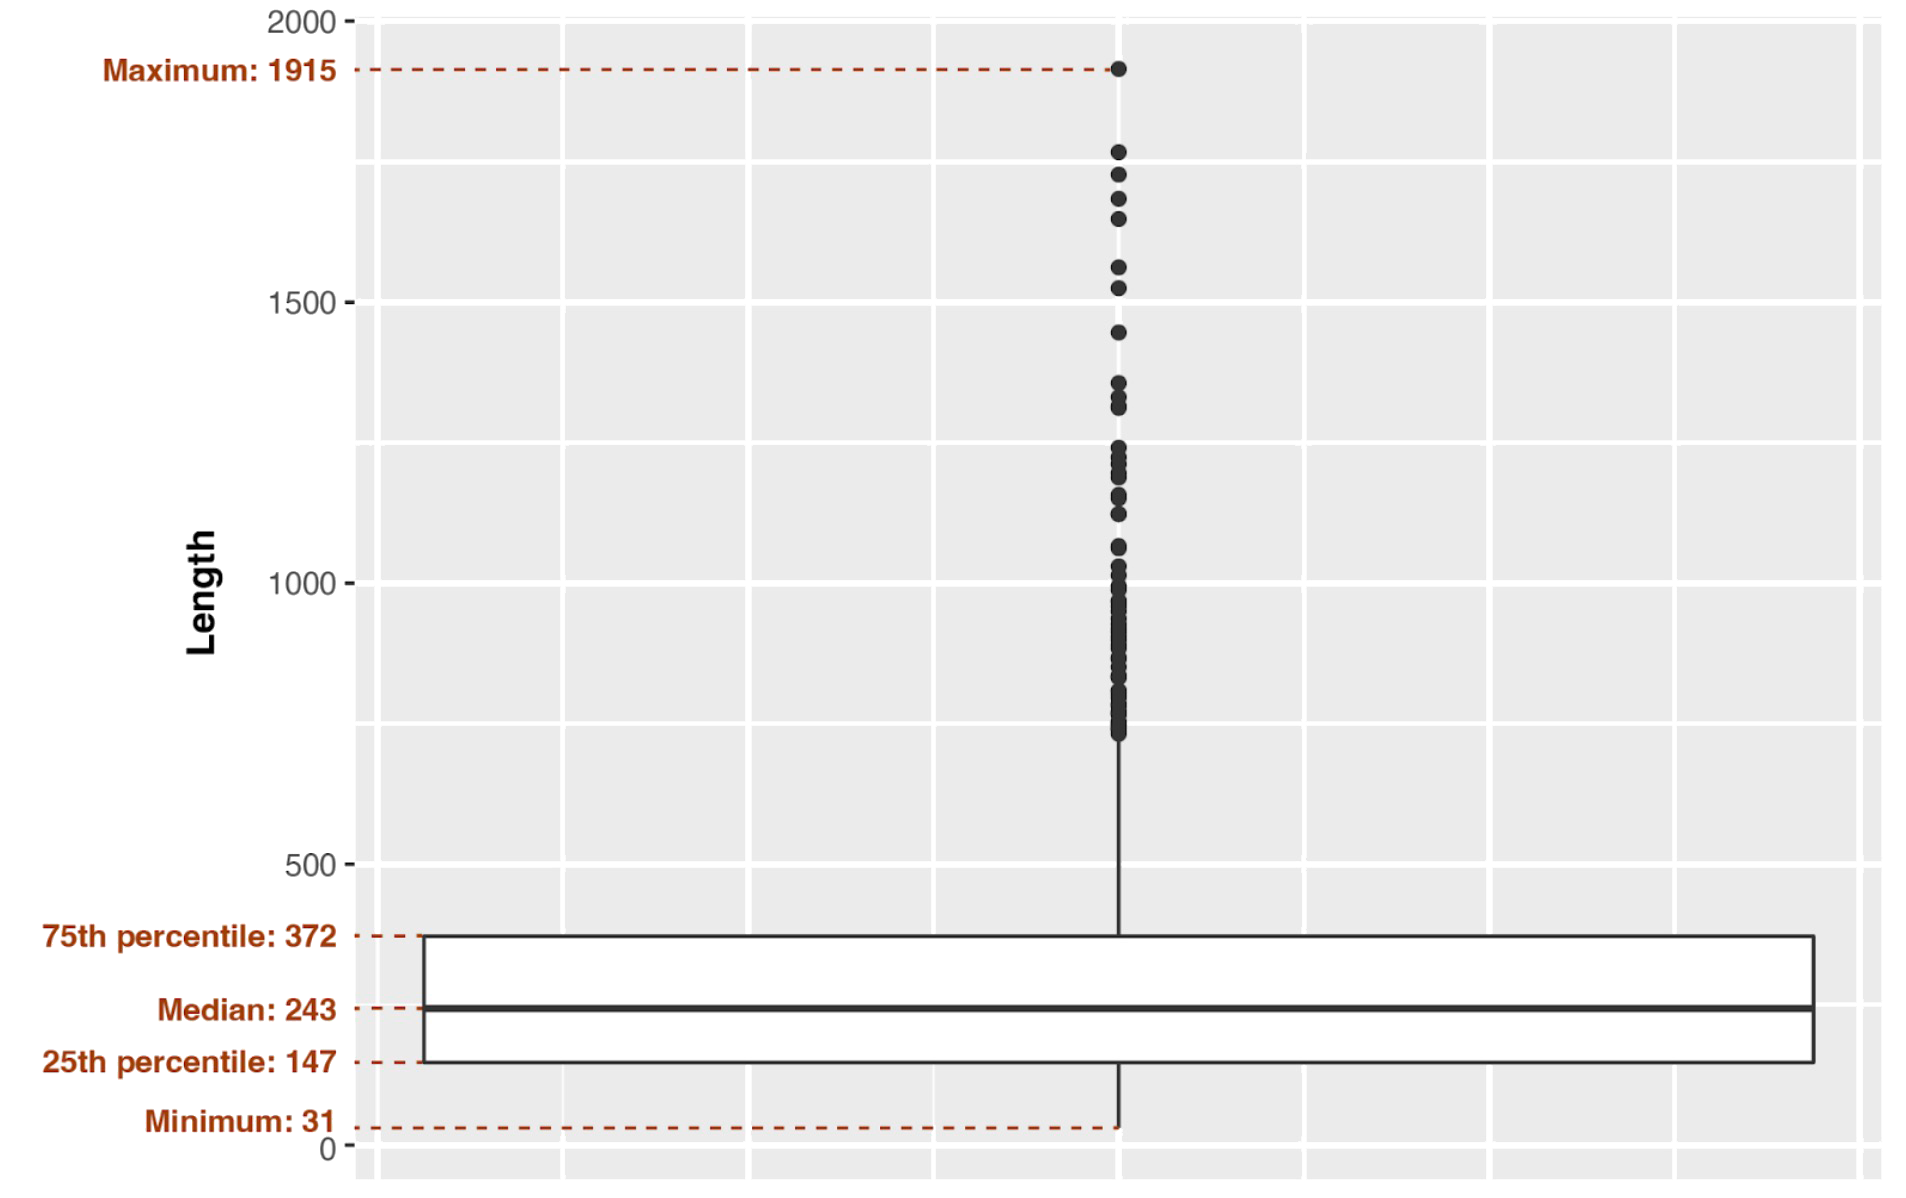
Also we calculated another values for protein length distribution such as minimum (31 aa), 25th percentile (147 aa), median (50th percentile, 243 aa), 75th percentile (372 aa) and maximum (1915 aa) which is shown on box plot (Fig. 5). Standard deviation is 201.646.
Acknowledgment
We are grateful to all the colleagues in the Department of Bioengineering and Bioinformatics in MSU (Moscow, Russia), in particular Ivan S. Rusinov, Sergey A. Spirin and Andrei V. Alexeevskii.
Supplementary materials
- S1. Thermococcus eurythermalis A501 genome feature table.
- S2. Thermococcus eurythermalis A501 chromosome sequence.
- S3. Thermococcus eurythermalis A501 plasmid sequence.
- S4. Python script for GC-skew counting.
- S5. Python script for frequencies of nucleotides counting.
References
McGill, R. et al. (1978). Variation of Box Plots. The American Statistician, 32(1), 12–16.
Siying, C. et al. (2021). Biohydrogen production with lipid-extracted Dunaliella biomass and a new strain of hyper-thermophilic archaeon Thermococcus eurythermalis A501. International Journal of Hydrogen Energy, 45, 12721–12730.
Tiessen, A. et al. (2012). Mathematical modeling and comparison of protein size distribution in different plant, animal, fungal and microbial species reveals a negative correlation between protein size and protein number, thus providing insight into the evolution of proteomes. BMC Research Notes, 5, 85.
Weishu, Z. and Xiang, X. (2014). Complete genome sequence of Thermococcus eurythermalis A501, a conditional piezophilic hyperthermophilic archaeon with a wide temperature range, isolated from an oil-immersed deep-sea hydrothermal chimney on Guaymas Basin. Journal of Biotechnology, 193, 14–15.
Weishu, Z. et al. (2015). Thermococcus eurythermalis sp. nov., a conditional piezophilic, hyperthermophilic archaeon with a wide temperature range for growth, isolated from an oil-immersed chimney in the Guaymas Basin. International Journal of Systematic and Evolutionary Microbiology, 65, 30–35.