#7 Изучение работы методов контроля температуры в молекулярной динамике
Задание: https://kodomo.fbb.msu.ru/wiki/2016/8/MolSim/task7 Тут мы изучаем, как реализован контроль температуры в молекулярной динамике на примере GROMACS. Исследуем на молекуле этана.
Скачиваем GROMACS v4.5.5 с ftp://ftp.gromacs.org/pub/gromacs
 cd ~
 tar -xvf ~/Downloads/gromacs-4.5.5.tar.gz
 cd gromacs-4.5.5
 mkdir build
 cd build
 cmake ..
 make
 sudo make install
// не получилось :(, пробуем на codomofrom subprocess import run
Для работы нужно скачать с кодомо gro файл (http://kodomo.fbb.msu.ru/FBB/year_08/term6/etane.gro) с координатами этана и 5 конфигурационных файлов с разными алгоритмами контроля температуры.
%%bash
wget http://kodomo.fbb.msu.ru/FBB/year_08/term6/etane.gro
wget http://kodomo.fbb.msu.ru/FBB/year_08/term6/be.mdp
wget http://kodomo.fbb.msu.ru/FBB/year_08/term6/vr.mdp
wget http://kodomo.fbb.msu.ru/FBB/year_08/term6/nh.mdp
wget http://kodomo.fbb.msu.ru/FBB/year_08/term6/an.mdp
wget http://kodomo.fbb.msu.ru/FBB/year_08/term6/sd.mdp
Файл с топологией для этана нам дан, но его нужно подредактировать:
- дописать все необходимые связи, валентные и торсионные углы
- поменять типы атомов: CX на opls_135, а HX на opls_140
- задать тип потенциала торсионных углов равеным 3
et_file = open('etane.top', 'w')
head = '''
#include "/usr/share/gromacs/top/oplsaa.ff/forcefield.itp"

[ moleculetype ]
; Name            nrexcl
et            3

[ atoms ]
;   nr  type  resnr  residue  atom   cgnr     charge       mass
    1   opls_135      1    ETH      C1      1    -0.189      12.01
    2   opls_135      1    ETH      C2      2    -0.155      12.01
    3   opls_140      1    ETH      H1      3     0.059       1.008
    4   opls_140      1    ETH      H2      4     0.059       1.008
    5   opls_140      1    ETH      H3      5     0.059       1.008
    6   opls_140      1    ETH      H4      6     0.056       1.008
    7   opls_140      1    ETH      H5      7     0.056       1.008
    8   opls_140      1    ETH      H6      8     0.056       1.008

[ bonds ]
;  ai    aj funct  b0       kb
     1   2   1
     1   3   1
     1   4   1
     1   5   1
     2   6   1
     2   7   1
     2   8   1

[ angles ]
;  ai    aj    ak funct  phi0   kphi
;around c1
    3     1     4     1
    3     1     5     1
    4     1     5     1
    2     1     3     1
    2     1     4     1
    2     1     5     1
;around c2
    6     2     7     1
    6     2     8     1
    7     2     8     1
    1     2     6     1
    1     2     7     1
    1     2     8     1

[ dihedrals ]
;  ai    aj    ak    al funct
    3    1     2     6      3
    3    1     2     7      3
    3    1     2     8      3
    4    1     2     6      3
    4    1     2     7      3
    4    1     2     8      3
    5    1     2     6      3
    5    1     2     7      3
    5    1     2     8      3

[ pairs ]
; atom list for 1-4
;  ai    aj funct
   3  6
   3  7
   3  8
   4  6
   4  7
   4  8
   5  6
   5  7
   5  8

[ System ]
; any text here
first one
[ molecules ]
;Name count
 et    1
'''
et_file.write(head)
%%bash
cat etane.top
%%bash
#файл для подсчёта длины C-C связи
echo -e "[ b ]\n1 2" > b.ndx

cat b.ndx
Алгоритмы контроля температуры
thermo_types = ['be', 'vr', 'nh', 'an', 'sd']
for thermo in thermo_types:
    # configs
    run_arg = f'grompp -f {thermo}.mdp -c etane.gro -p etane.top -o etane_{thermo}.tpr'
    print(run_arg)
    run(run_arg, shell=True)
    print(thermo + '\tconfig')
    # mdrun
    run_arg = f'mdrun -deffnm etane_{thermo} -v -nt 1'
    print(run_arg)
    run(run_arg, shell=True)
    print(thermo + '\tmdrun')
    # pdb
    run_arg = f'echo 0 | trjconv -f etane_{thermo}.trr -s etane_{thermo}.tpr -o etane_{thermo}.pdb'
    print(run_arg)
    run(run_arg, shell=True)
    print(thermo + '\tpdb')
    # energies
    run_arg = f'echo 10 11 | g_energy -f etane_{thermo}.edr -o etane_{thermo}_en.xvg -xvg none'
    print(run_arg)
    run(run_arg, shell=True)
    print(thermo + '\tenergies')
    # C-C bond lengths
    run_arg = f'g_bond -f etane_{thermo}.trr -s etane_{thermo}.tpr -o bond_{thermo}.xvg -n b.ndx -xvg none'
    print(run_arg)
    run(run_arg, shell=True)
    print(thermo + '\tbond lengths')
Отлично, спасибо kodomo. Теперь го локально.
import imageio
from IPython.display import display, Image
from pathlib import Path

import time
import os
import shutil
import asyncio
import numpy as np

from xmlrpc.client import ServerProxy
from IPython.core.display import HTML

IMAGE_FOLDER = 'pr7_assets'

Path(IMAGE_FOLDER).mkdir(parents=True, exist_ok=True)
cmd = ServerProxy(uri="http://localhost:9123/RPC2")
for thermo in thermo_types:
    cmd.reinitialize()
    cmd.set('sphere_scale', 0.2)
    cmd.set('stick_radius', 0.1)
    cmd.set('ray_trace_mode', 3)
    cmd.set('antialias', 2)
    cmd.set('sphere_scale', 0.2)
    cmd.set('stick_radius', 0.1)

    cmd.load(f'etane_{thermo}.pdb')
    cmd.show('spheres')
    cmd.orient()
    print(thermo)

    Path(thermo).mkdir(parents=True, exist_ok=True)
    cmd.do('color deuterium, name H*')
    cmd.do('color ruthenium, name C*')
    cmd.do(f'mpng {thermo}/{thermo}, width=480, height=360, mode=2')
for thermo in thermo_types:
    with imageio.get_writer(f'{thermo}.gif', mode='I', fps=30) as writer:
        for i in range(0, 251):
            image = imageio.imread(os.path.join(
                f'{thermo}/', f'{thermo}{i + 1:04}.png'))
            writer.append_data(image)
| метод Берендсена | метод "Velocity rescale" |
|---|---|
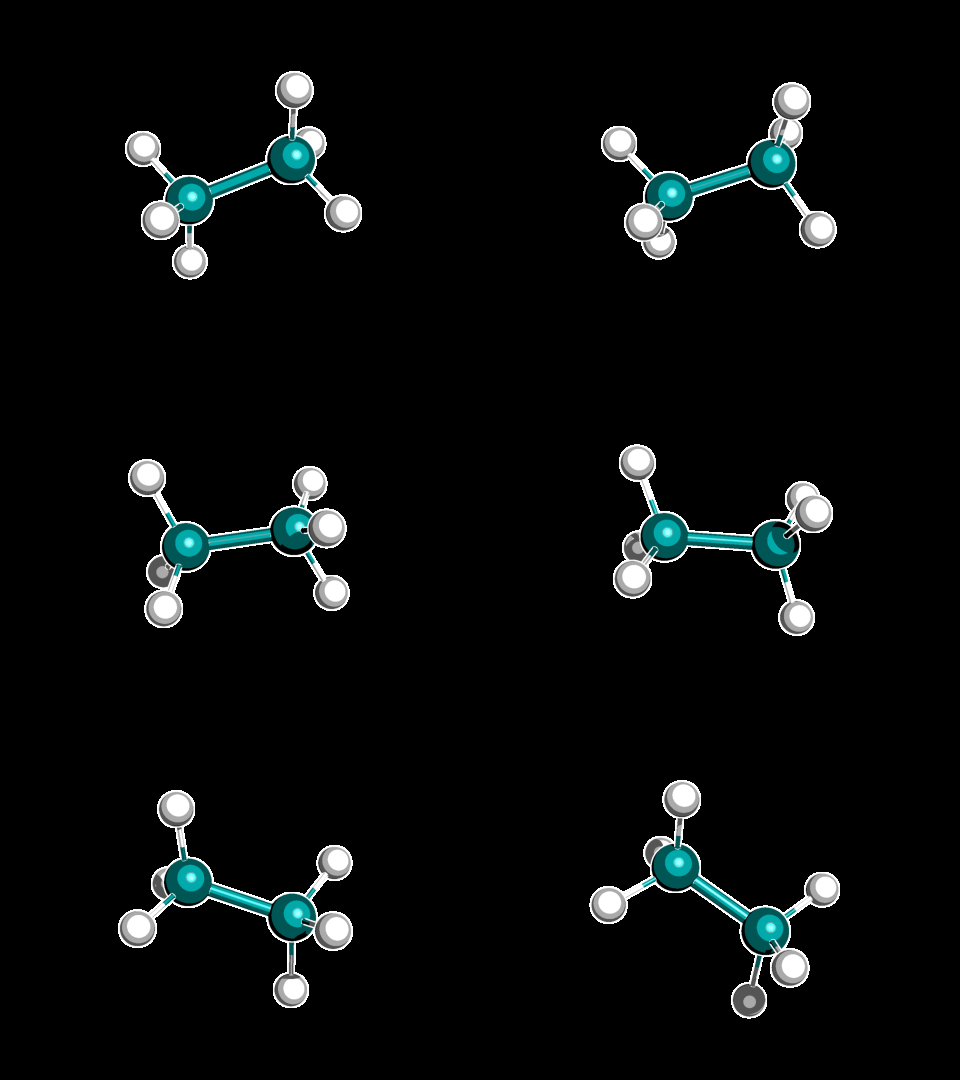 |
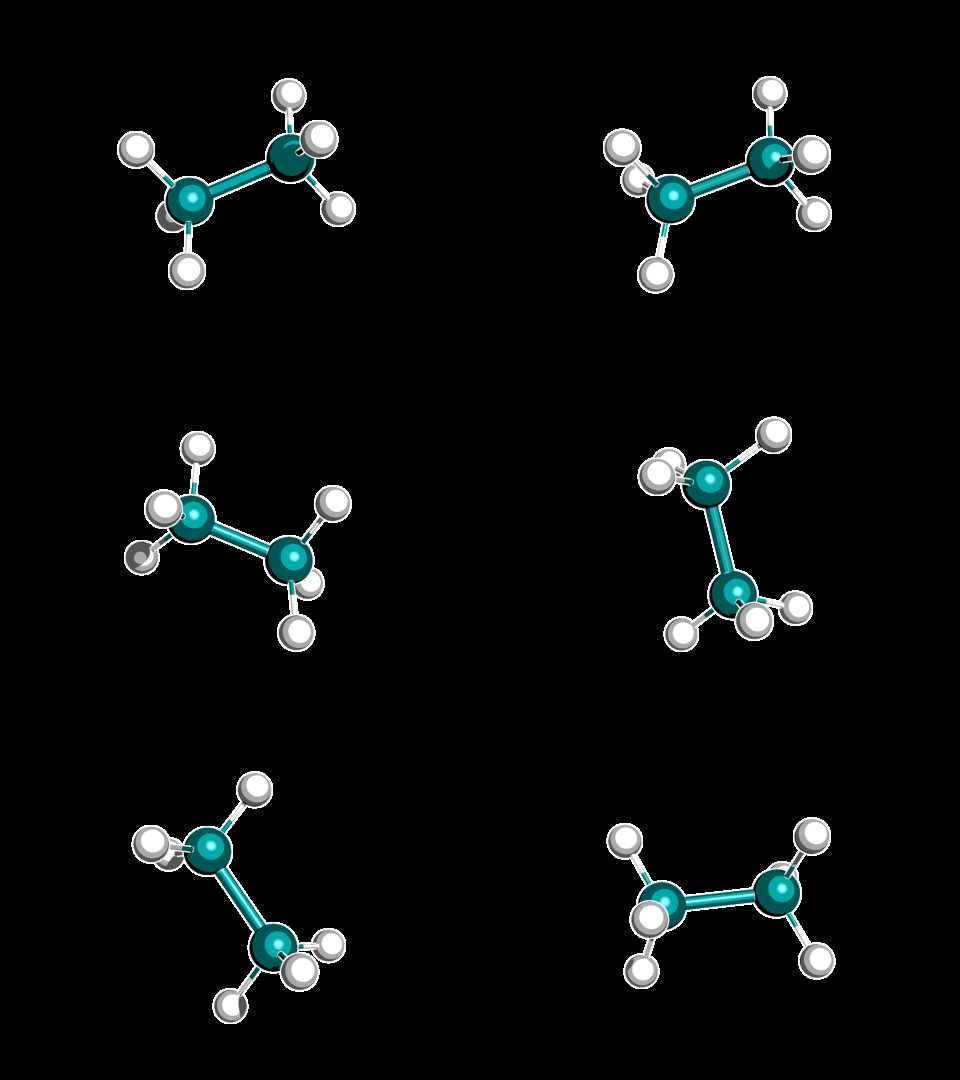 |
| метод Нуза-Хувера | метод Андерсена |
|---|---|
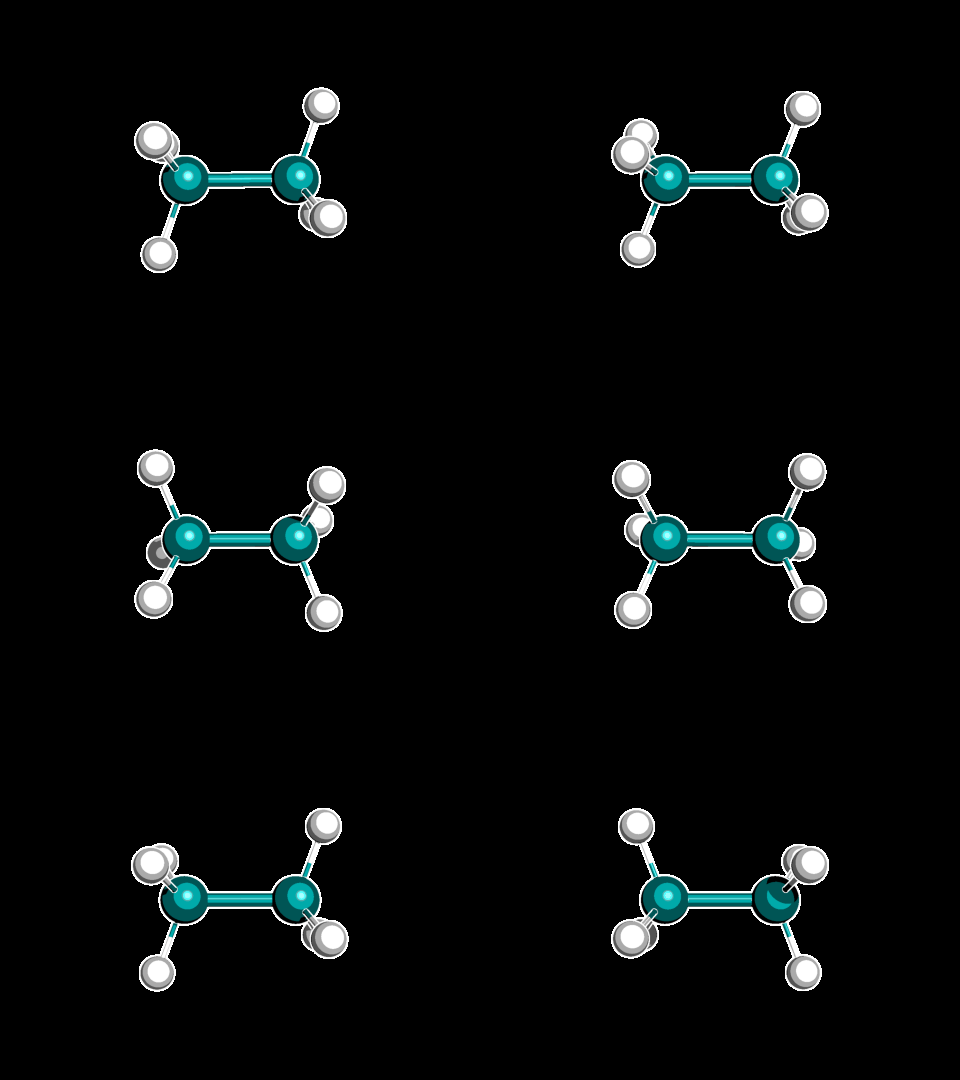 |
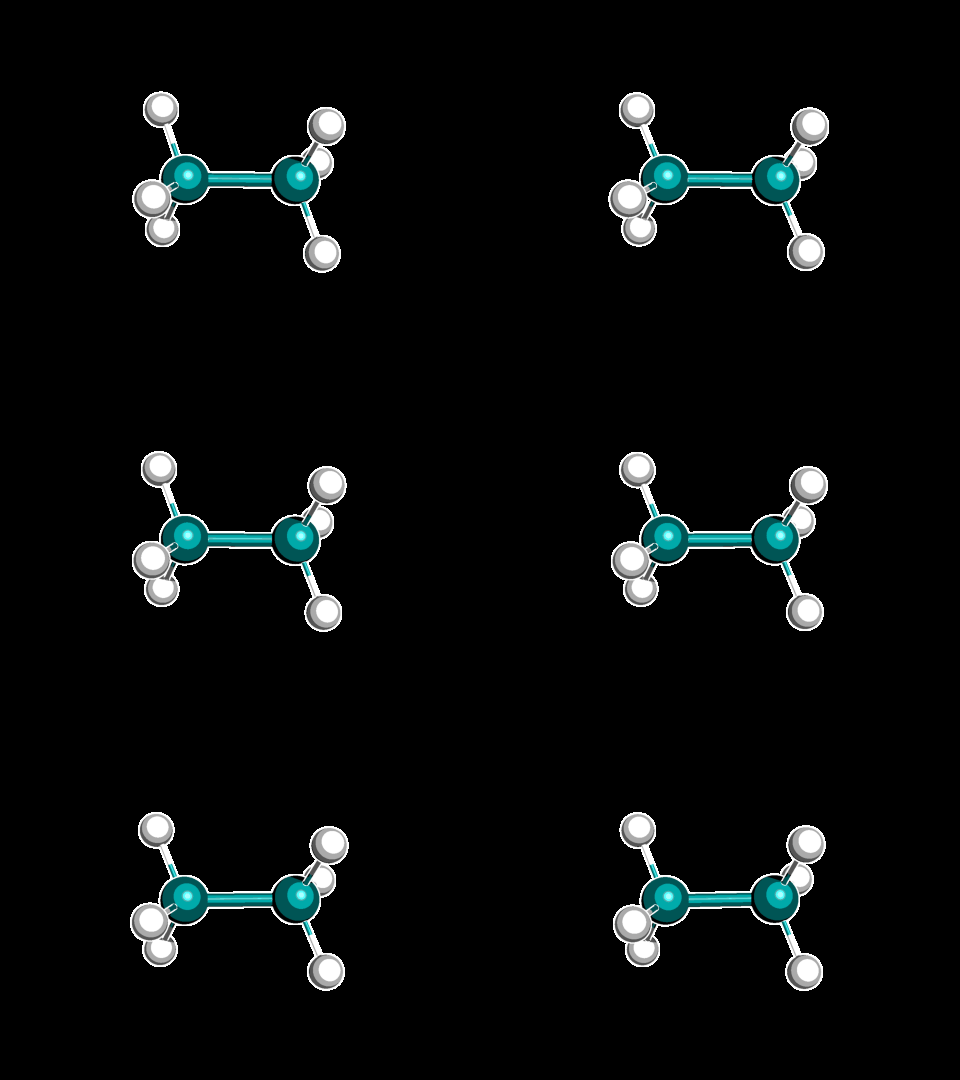 |
| метод стохастической молекулярной динамики |
|---|
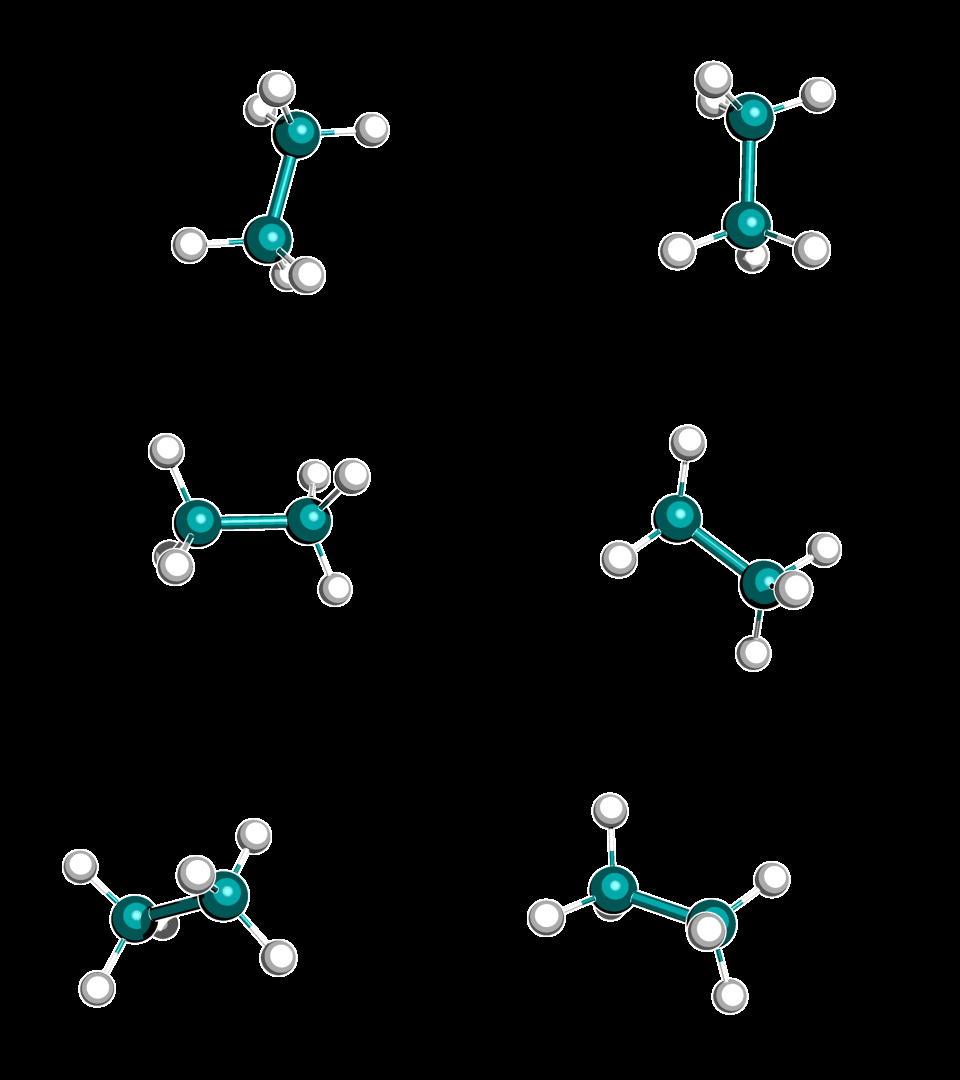 |
Так, получились чудесные гифки. Немного о сравнении алгоритмов:
- Метод Берендсена - вращение водородов вокруг С-С связи происходит почти равномерно. Это не очень правильно, так как мы знаем, что в заторможенной конформации этан существует больше времени, чем заслоненной, тк она более энергетически выгодна;
- Метод "Velocity rescale" - здесь уже можно увидеть, что есть две конформации, и в одной молекула адерживается. Кроме того, молекула перемещается в пространстве.
- Метод Нуза-Хувера - тоже видны две конформации, но молекула висит на одном месте. Кажется, есть небольшое колебание длины С-С связи.
- Метод Андерсена - молекула просто дрожит. Выглядит не очень правдоподобно.
- Метод стохастической молекулярной динамики - молекула двигается в пространстве хаотично, уловить движение вокруг связи не получается.
Видимо, самые удачные - это метод "Velocity rescale" и метод Нуза-Хувера, в зависимости от целей (хотим мы видеть вращение всей молекулы или нет) мтоит использовать один из них.
Анализ энергий
import numpy as np
import matplotlib.pyplot as plt
import matplotlib as mpl

thermo_names = ['Berendsen', 'V-rescale', 'Nose-Hoover', 'Andersen', 'Stochastic']
plt.figure(figsize=(15, 10))
for i, therms in enumerate(zip(thermo_types, thermo_names)):
    mpl.style.use('seaborn')
    thermo, name = therms
    plt.subplot(2, 3, i + 1)
    time, pot, kin = np.loadtxt(f'etane_{thermo}_en.xvg').T
    plt.plot(time, kin + pot, label='total')
    plt.plot(time, pot, alpha=.7, label='potential')
    plt.plot(time, kin, alpha=.7, label='kinetic')
    plt.xlabel('Time, ps')
    plt.ylabel('Energy, kJ/mol')
    plt.title(name)
    plt.legend(title='Energies', loc='lower right')

plt.tight_layout()
- Методы Андерсена и Берендсена поддерживают полную энергию на постоянном уровне, потенциальная больше кинетической, колебания периодические. Энергия у Берендсена выше, чем у Андерсена. Остальные методы показывают большие колебания энергий.
- Метод Ноуз-Хувера показывает примерно одинаковые кинетическую и потенциальную энергии, но он часто оказывается около нуля, что не очень стабильно.
- V-rescale и стохастический методы похожи по стабильности колебаний энергии, но у стохастического вклад кинетической энергии больше (потому он выдает настолько хаотические метания).
По колебаниям энергий я бы сказала, что самый надежный метод - V-rescale.
Распределение длины C-C связи
target = 0.1522
plt.figure(figsize=(15, 10))
for i, therms in enumerate(zip(thermo_types, thermo_names)):
    thermo, name = therms
    plt.subplot(2, 3, i + 1)
    lengths, values = np.loadtxt(f'bond_{thermo}.xvg').T
    plt.bar(lengths, values, width=0.0003, label='data')
    plt.axvline(target, color='red', label='0.1522 nm')
    plt.xlim(target - 0.02, target + 0.02)
    plt.xlabel('Bond length, nm')
    plt.title(name)
    plt.legend()
plt.tight_layout()
Пик распределения длины С-С во всех методах находится на значении 0.1522 нм. Методы Андерсена и Берендсена показывают меньшую дисперсию распределения длины связи, что ожидаемо, так как в этих методах меньше колебаниями энергии. У стохастического метода самые тяжелые хвосты и довольно большая дисперсия.
Распределение энергий
plt.figure(figsize=(15, 10))
for i, therms in enumerate(zip(thermo_types, thermo_names)):
    thermo, name = therms
    plt.subplot(2, 3, i + 1)
    time, pot, kin = np.loadtxt(f'etane_{thermo}_en.xvg').T
    plt.hist(kin + pot, bins=100)
    plt.xlabel('Energy, kJ/mol')
    plt.title(name + ": total energy distribution")
plt.tight_layout()
Честно говоря, не знаю, как это интерпретировать. Метод Ноуза-Хувера выдает результат, похожий на распределение Больцмана. Метод Андерсена из всех имеет минимальную дисперсию, метод Бренстеда выдал распределение как-то очень далеко уехавшее от нуля.
Итого, самый хороший метод учета влияния температуры, похоже Ноуз-Хувер.