A and B forms of DNA. RNA structure
Last updated: 27-09-2017.
Files to download
[Archive containing .pdb files from Task 1]
[Excel file containing information about torsion angles]
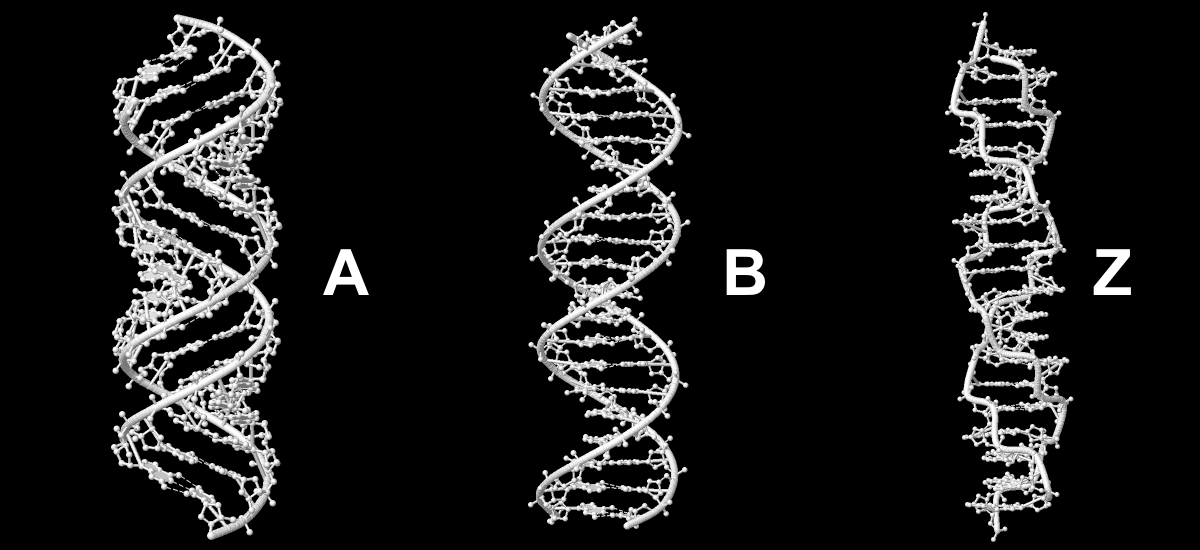
Task 1. Generating A, B and Z forms of DNA
Using 3DNA tools .pdb files of A, B and Z forms of DNA were created (sequence is GATC repeated 5 times for A and B forms and GC repeated 10 times for Z form). Obtained structures are shown in Fig. 1.
Task 2. Comparing of A, B and Z forms using Jmol
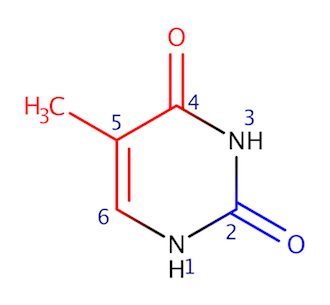
Major and minor grooves
Major groove contains C6, C5, C7, C4 and O4 atoms (of thymine). Minor groove contains C2, N1 and O2 atoms (of thymine). In Fig. 2, atoms that are located in major groove are colored red, atoms that are located in minor groove are colored blue.
Main parameters of studied DNA forms
Main information obtained about DNA forms is shown in Table 1.
| A form | B form | Z form | |
|---|---|---|---|
| Helix | Right-handed | Right-handed | Left-handed |
| Length per turn | 28.03 Å | 33.7 Å | 43.5 Å |
| Amount of bases per turn | 11 | 10 | 12 |
| Major groove width | 7.98 Å [G]29:B.P-[A]6:A.P | 17.21 Å [G]33:B.P-[G]5:A.P | 9.87 Å [G]17:A.P-[C]28:B.P |
| Minor groove width | 16.81 Å [T]15:A.P-[C]28:B.P | 11.69 Å [G]25:B.P-[C]20:A.P | 16.08 Å [C]12:A.P-[C]28:B.P |
Table 1. Main parameters of studied DNA forms.
Task 3. 3DNA
Torsion angles
As it easy to notice, tRNA's average torsion angles seems to be very close to A-form of DNA except beta angle. Using excel resources the most 'deviated' nucleotide was found in observed tRNA structure (26C). Information about this nucleotide as well as about torsion angles generally is provided in Table 1.
| alpha | beta | gamma | delta | epsilon | zeta | chi | |
|---|---|---|---|---|---|---|---|
| A-form | -51,7 | 174,8 | 41,7 | 79,1 | -147,8 | -75,1 | -157,2 |
| B-form | -29,9 | 136,3 | 31,2 | 143,3 | -140,8 | -160,5 | -98 |
| Z-form | -139,5 | -136,8 | 50,9 | 137,6 | -96,5 | 82 | -154,3 |
| RNA (1evv) | -55,8 | 75,9 | 45,2 | 88,3 | -148,0 | -72,8 | -153,2 |
| DNA (1cf7) | -19,7 | -5,7 | 26,8 | 141,2 | -88,4 | -50,8 | -110,2 |
| 26С (1evv) | 138.0 | -155,7 | -163,9 | 79,3 | -169,9 | -79,1 | -168,2 |
Table 1. Information about torsion angles in studied structures.
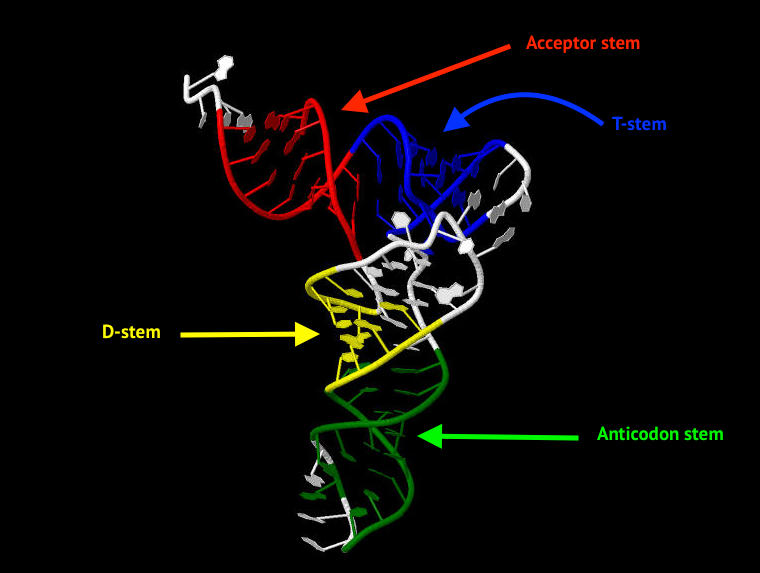
Hydrogen bonds in tRNA
Nucleotides involved in the organisation of stems are given below. Also, Fig. 3 is explaining stems location in tRNA structure.
          Strand I                    Strand II          Helix
   1   (0.003) ....>A:...1_:[..G]G-----C[..C]:..72_:A<.... (0.005)     |
   2   (0.004) ....>A:...2_:[..C]C-----G[..G]:..71_:A<.... (0.006)     |
   3   (0.008) ....>A:...3_:[..G]G-----C[..C]:..70_:A<.... (0.006)     |
   4   (0.009) ....>A:...4_:[..G]G-*---U[..U]:..69_:A<.... (0.007)     |
   5   (0.009) ....>A:...5_:[..A]A-----U[..U]:..68_:A<.... (0.008)     |
   6   (0.007) ....>A:...6_:[..U]U-----A[..A]:..67_:A<.... (0.016)     |
   7   (0.007) ....>A:...7_:[..U]U-----A[..A]:..66_:A<.... (0.012)     |
          Strand I                    Strand II          Helix
   8   (0.017) ....>A:..49_:[5MC]c-----G[..G]:..65_:A<.... (0.017)     |
   9   (0.015) ....>A:..50_:[..U]U-----A[..A]:..64_:A<.... (0.015)     |
  10   (0.011) ....>A:..51_:[..G]G-----C[..C]:..63_:A<.... (0.009)     |
  11   (0.014) ....>A:..52_:[..U]U-----A[..A]:..62_:A<.... (0.022)     |
  12   (0.015) ....>A:..53_:[..G]G-----C[..C]:..61_:A<.... (0.006)     |
          Strand I                    Strand II          Helix
  15   (0.007) ....>A:..36_:[..A]A-**--U[..U]:..33_:A<.... (0.008)     |
  16   (0.007) ....>A:..38_:[..A]A-**--c[OMC]:..32_:A<.... (0.008)     |
  17   (0.021) ....>A:..39_:[PSU]P-*---A[..A]:..31_:A<.... (0.006)     |
  18   (0.010) ....>A:..40_:[5MC]c-----G[..G]:..30_:A<.... (0.009)     |
  19   (0.008) ....>A:..41_:[..U]U-----A[..A]:..29_:A<.... (0.006)     |
  20   (0.012) ....>A:..42_:[..G]G-----C[..C]:..28_:A<.... (0.005)     |
  21   (0.011) ....>A:..43_:[..G]G-----C[..C]:..27_:A<.... (0.006)     |
  22   (0.008) ....>A:..44_:[..A]A-**--g[M2G]:..26_:A<.... (0.010)     |
          Strand I                    Strand II          Helix
  23   (0.017) ....>A:..10_:[2MG]g-----C[..C]:..25_:A<.... (0.006)     |
  24   (0.006) ....>A:..11_:[..C]C-----G[..G]:..24_:A<.... (0.017)     |
  25   (0.009) ....>A:..12_:[..U]U-----A[..A]:..23_:A<.... (0.013)     |
  26   (0.011) ....>A:..13_:[..C]C-----G[..G]:..22_:A<.... (0.011)     |
Using .out file it was discovered that studied structure contains 6 non-Watson-Crick base-pairs that are given in insertion below:
 Strand I                    Strand II          Helix
  4   (0.009) ....>A:...4_:[..G]G-*---U[..U]:..69_:A<.... (0.007)      |
  13   (0.011) ....>A:..54_:[5MU]t-**--a[1MA]:..58_:A<.... (0.048)     |
  14   (0.018) ....>A:..55_:[PSU]P-**+-G[..G]:..18_:A<.... (0.025)     x
  16   (0.007) ....>A:..38_:[..A]A-**--c[OMC]:..32_:A<.... (0.008)     |
  17   (0.021) ....>A:..39_:[PSU]P-*---A[..A]:..31_:A<.... (0.006)     |
  22   (0.008) ....>A:..44_:[..A]A-**--g[M2G]:..26_:A<.... (0.010)     |
It is noticeable that observed structure has non-canonical base pseudouridine.
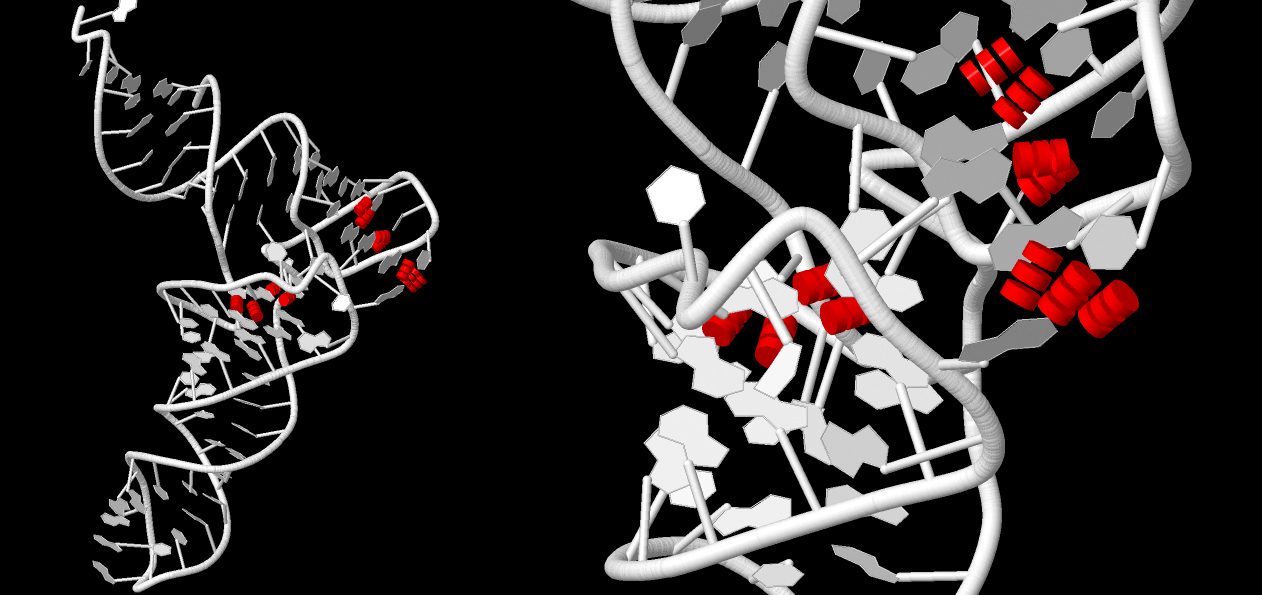
Stabilising hydrogen bonds were determined by paying attention to complementary pairs that are not part of the stalk structure:
          Strand I                    Strand II          Helix
   13   (0.011) ....>A:..54_:[5MU]t-**--a[1MA]:..58_:A<.... (0.048)     |
   14   (0.018) ....>A:..55_:[PSU]P-**+-G[..G]:..18_:A<.... (0.025)     x
   27   (0.017) ....>A:..14_:[..A]A-**--U[..U]:...8_:A<.... (0.008)     |
   28   (0.018) ....>A:..15_:[..G]G-**+-C[..C]:..48_:A<.... (0.013)     x
   29   (0.018) ....>A:..19_:[..G]G-----C[..C]:..56_:A<.... (0.012)     +
Suggested stabilising hydrogen bonds are presented in Fig. 4.
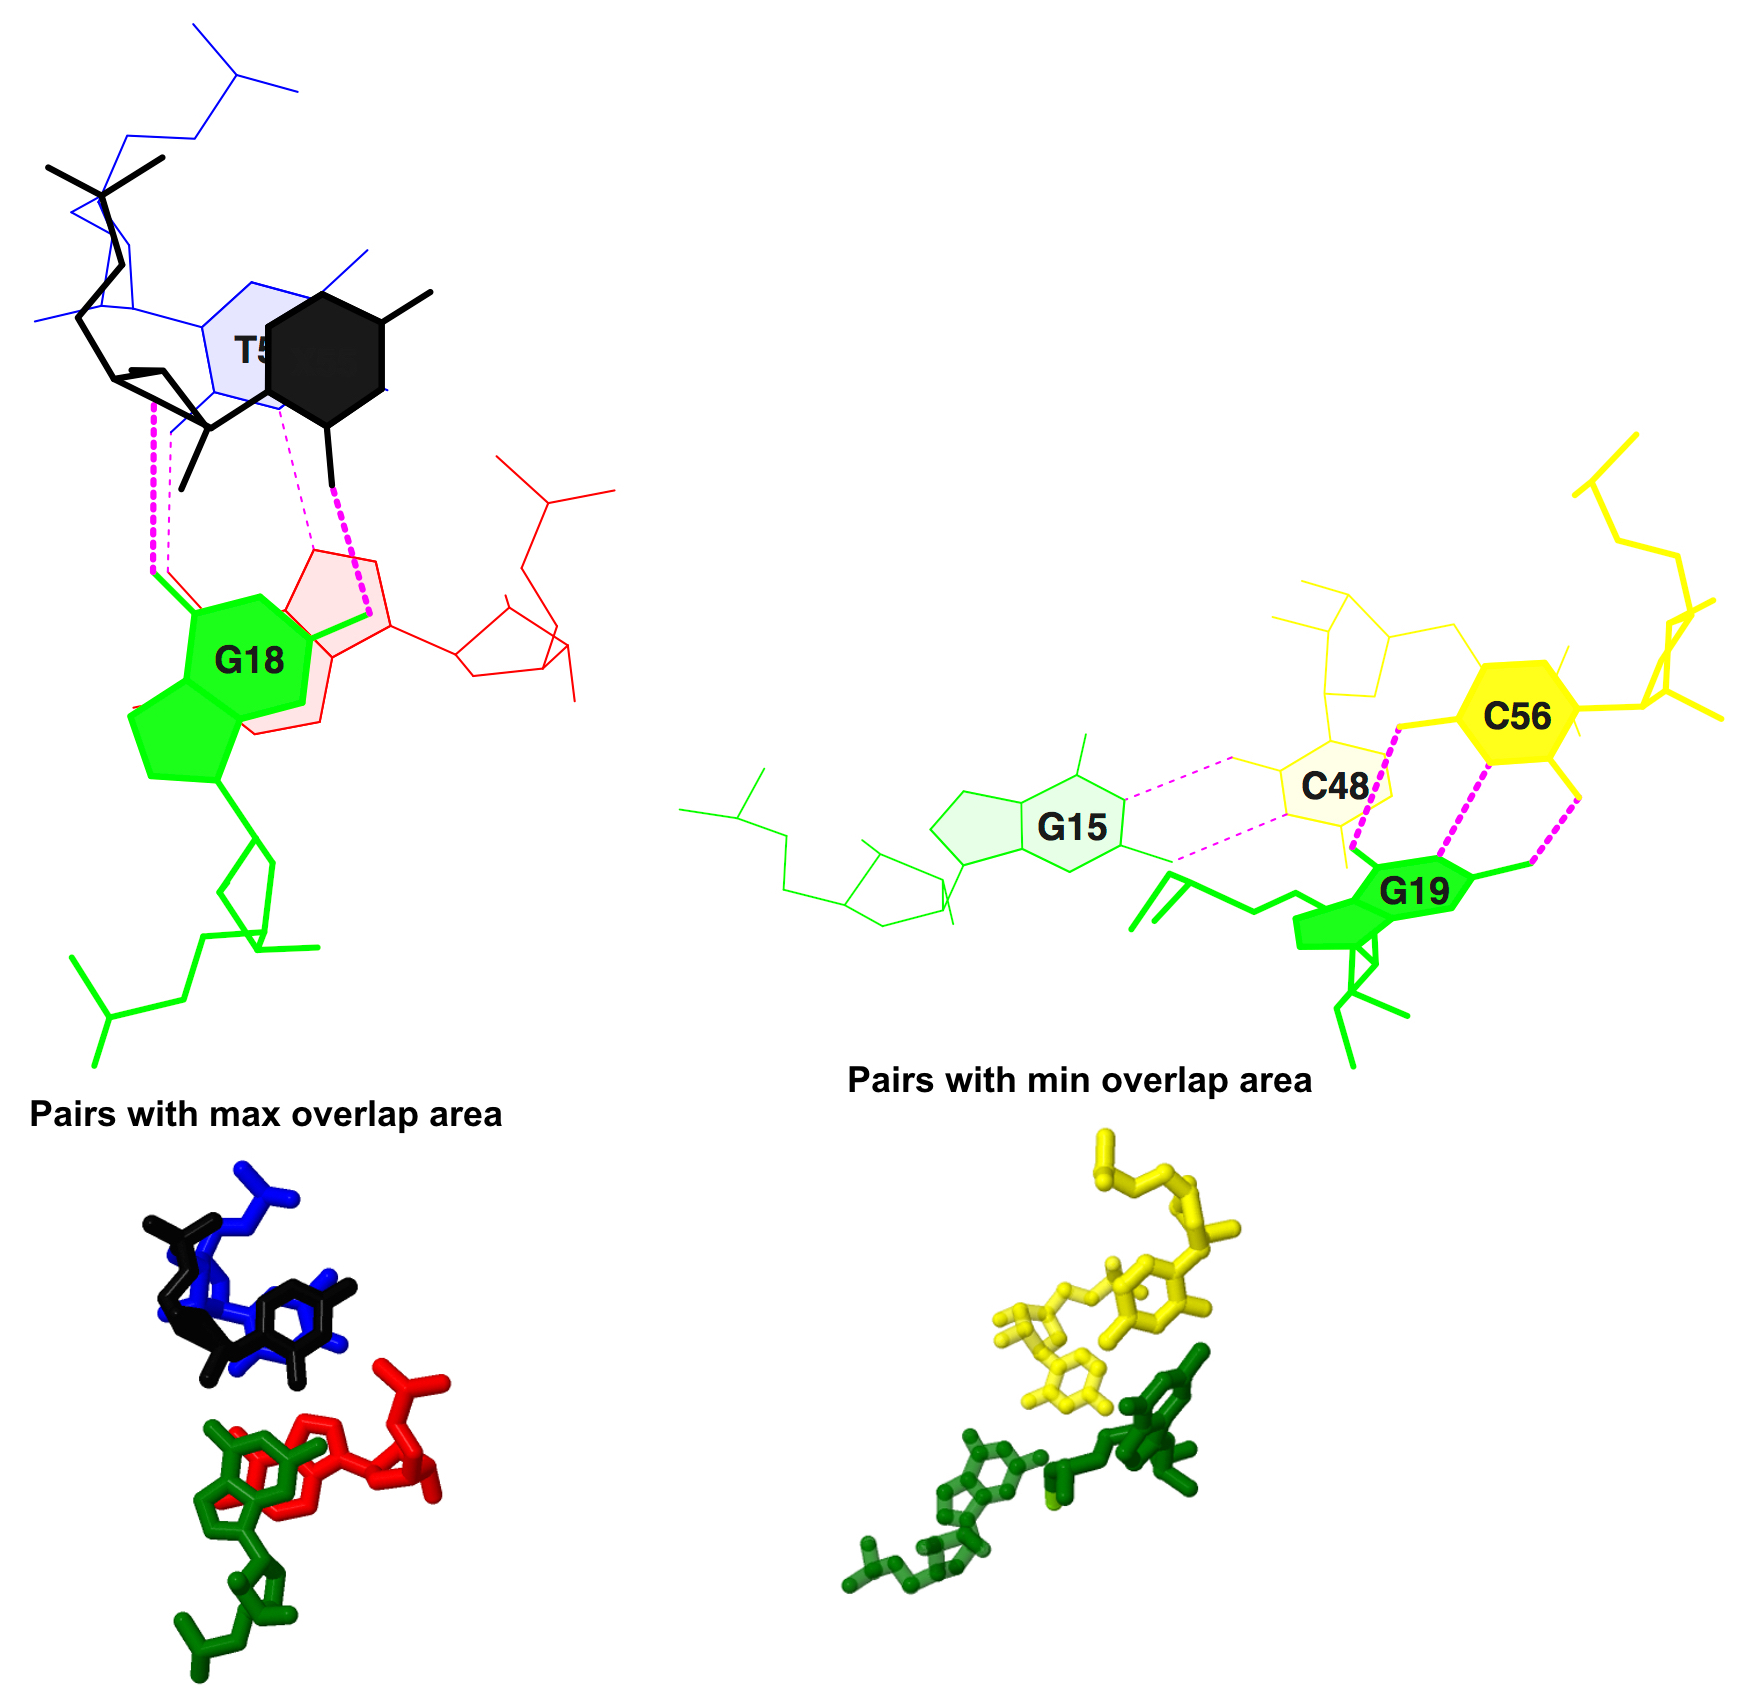
Сalсulated stacking interactions
Information from 1evv.out file, result of analysis of 1evv.pdb file by find_pair program:
step      i1-i2        i1-j2        j1-i2        j1-j2        sum
13 tP/Ga  5.72( 1.89)  0.00( 0.00)  0.00( 0.00)  8.48( 3.73) 14.20( 5.63)
28 GG/CC  0.00( 0.00)  0.00( 0.00)  0.00( 0.00)  0.00( 0.00)  0.00( 0.00)
According to these lines max overlap area is 14.20 Å^2 between tP/Ga residues (P stands for pseudouridine), min is 0.00 between GG/CC pairs.