|
Home page Term 1 Term 2 Term 3 About me Faculty website |
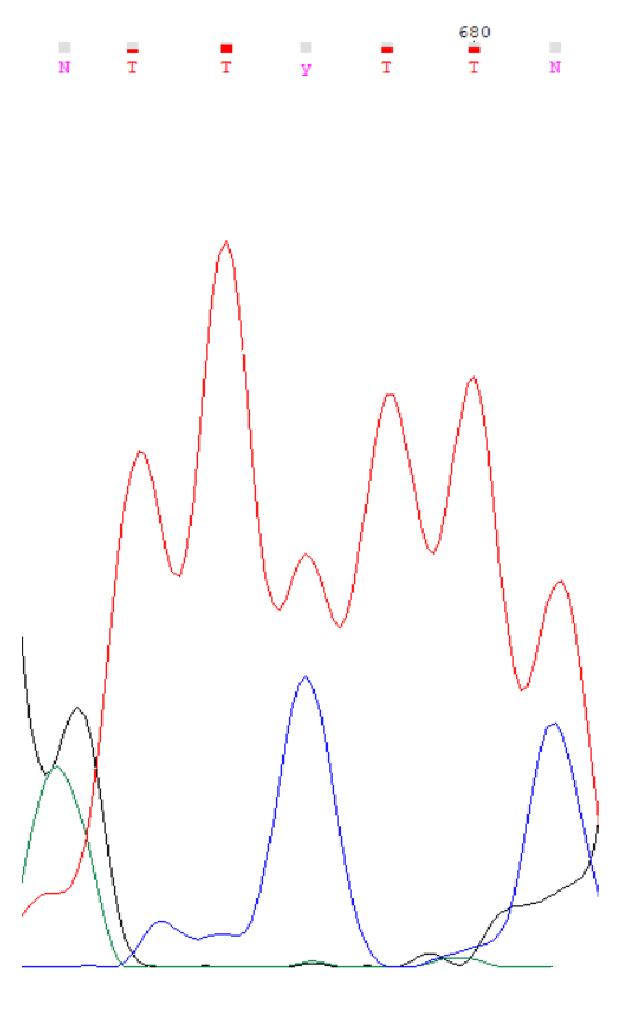
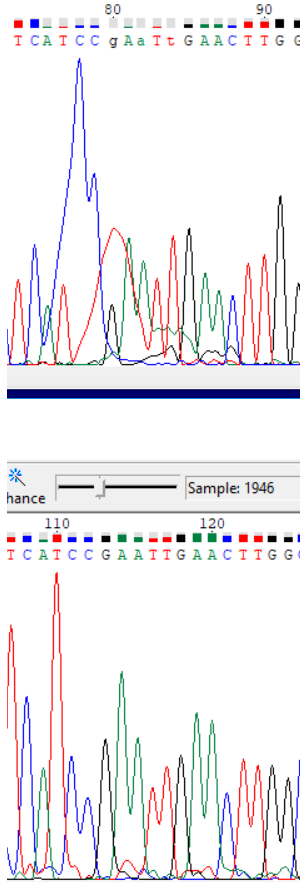
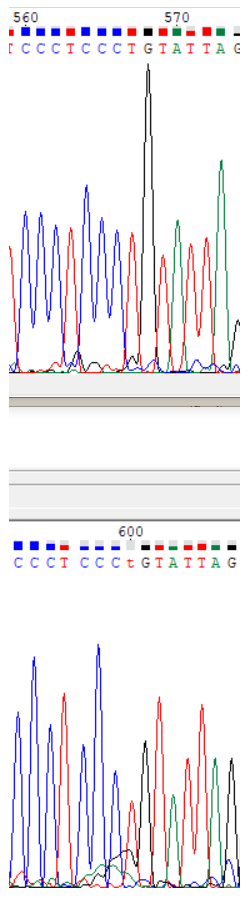
Sanger sequencingInterpreting results of Sanger sequencingForward read (.ab1 file)Reverse read (.ab1 file) In order to obtain a sequence from forward and reverse Sanger sequencing reads, Chromas Lite was used. The first completely uninterpretable region is 715-717 (all coordinates are in the forward read). One can also interpret the nucleotides from -30th to 0th in the forward read using the reverse one. Although this region is absent from the forward read, it is included in the resulting sequence because it is unimportant which read one is using to obtain the sequence. In the reverse read nucleotides -33 - -31 are also completely uninterpretable. Chromatogram descriptionUninterpretable regions in the forward read are 1-24 (interpreted with the reverse read) and 715-717, while in the reverse read they are -33 - -31 and 666-688 (interpreted using the forward read). The lengths of these regions are 24, 3, 3 and 23 nucleotides, respectively.On average, baseline noise peaks are less than 10% of the signal peaks' height, so signal to noise ratio is roughly 10-15. The signal peak height is more or less uniform across the chromatograms, with the exception of abnormally tall peaks at the ends. Noise peaks do not change in height significantly across the the chromatograms. Unclear nucleotide reads
ResultHere is a JalView project containing an alignment of truncated and edited forward and reverse reads.Here is the resulting sequence in FASTA format. Poor quality chromatogram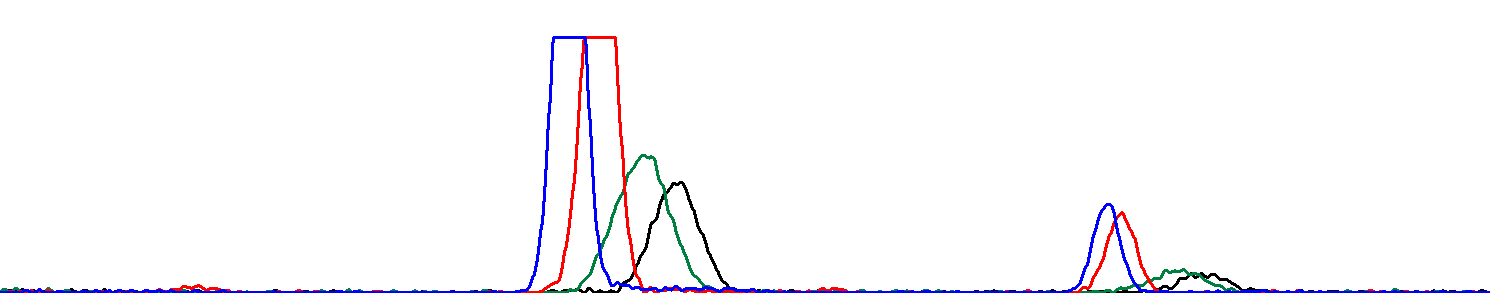 The same chromatogram zoomed: 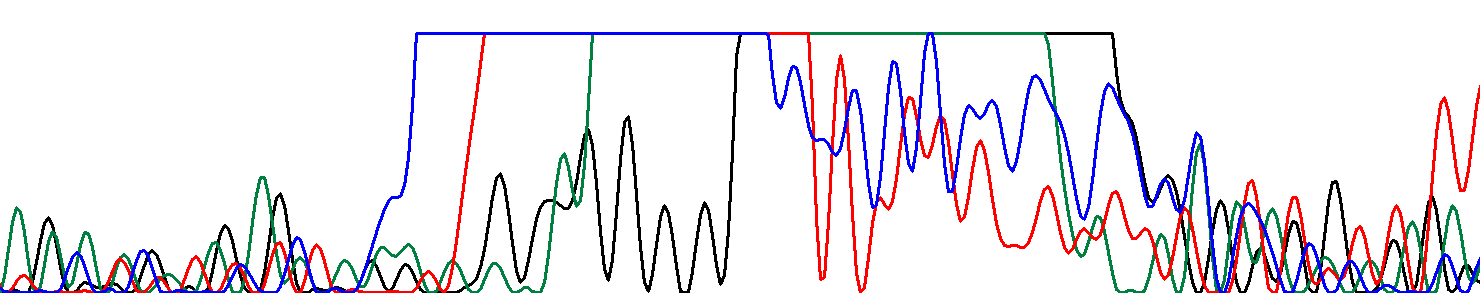 Here it is obvious that the abnormally high peaks stem from a droplet of fluorophores in the electrophoresis capillary. |
© Stanislav Tikhonov, 2018