|
Home page Term 1 Term 2 Term 3 About me Faculty website |
Nucleic AcidsForms of Nucleic AcidsHere are the three forms of DNA returned by the fiber program:A-DNA: (GATC)5 B-DNA: (GATC)5 Z-DNA: (GC)10 The following section contains an analysis of the B form of DNA (PDB: 1bna). Nucleobase orientation analysisThe spatial arrangement of the 20th thymine of the B strand was analyzed.The atoms facing the major groove are: 20:B.C4 20:B.O4 20:B.C5 20:B.C6 20:B.C7 The atoms facing the minor groove are: 20:B.N1 20:B.C2 20:B.O2 20:B.N3 The drawing of the thymine (obtained with MarvinSketch) is presented below, together with the MarvinSketch project: 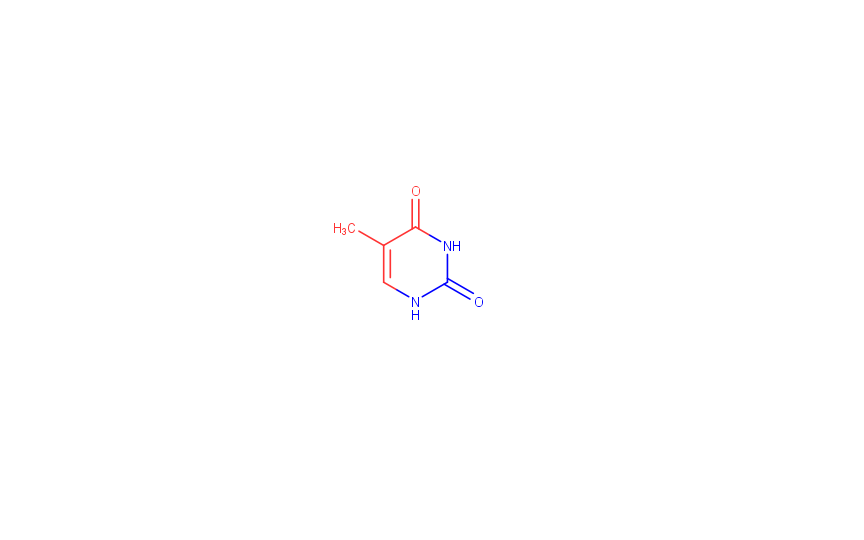 The atoms facing the major groove are colored red, while those facing the minor groove are colored blue. MarvinSketch project Structure analysis
*Source: David W Ussery: DNA Structure: A-, B- and Z-DNA Helix Families Torsion anglesIn this and the following sections the analysis of different aspects of tRNA structure is presented. The given tRNA structure's PDB ID is 5AXM.In order to obtain the values of the nucleic acids' backbone torsion angles the following pipeline was used: find_pair -t 5axm.pdb stdout | analyzeOne can see the angles for strand 1 of the tRNA structure below: base alpha beta gamma delta epsilon zeta chi 1 g --- --- 51.6 84.3 -146.7 -90.5 -173.3 2 G -44.9 163.9 63.5 78.7 -151.7 -83.1 -168.2 3 G -53.2 161.6 59.8 80.3 -142.5 -80.3 -170.7 4 A -54.9 161.6 54.4 81.2 -145.5 -75.8 -163.4 5 U -55.8 166.0 53.8 80.4 -143.7 -78.5 -161.4 6 U -48.9 167.8 62.0 142.5 -97.7 -53.5 -121.4 7 C 45.2 172.4 50.3 83.3 -148.6 -72.8 -173.2 8 U -60.2 -179.6 52.0 80.1 -146.0 -76.8 -168.6 9 G -58.3 170.4 49.5 78.3 -147.9 -76.0 -166.6 10 U -52.0 165.0 53.2 79.8 -163.6 -80.6 -158.1 11 G 143.2 -151.1 -175.6 83.4 -128.9 -78.4 176.5 12 U -52.0 171.6 42.0 81.6 -133.2 -68.0 -159.7 13 U -57.5 168.1 45.8 79.1 -132.0 -64.6 -155.9 14 A 130.1 -169.4 -164.3 87.1 -145.6 -5.9 -160.9 15 A -69.6 163.0 68.8 80.4 -161.0 -68.1 -169.9 16 U -158.7 -149.9 114.8 83.2 -177.6 -72.5 -172.9 17 C -140.2 -147.6 101.4 81.8 -148.6 -70.1 -160.9 18 U -63.1 174.9 52.5 80.0 -139.5 -84.4 -165.1 19 G -63.0 151.4 62.8 78.9 -145.4 -75.9 -170.3 20 G -52.5 167.1 50.3 80.4 -143.5 -95.4 -166.5 21 A -36.8 151.4 43.9 79.9 -131.5 -77.2 -162.7 22 G 179.5 166.4 57.1 87.4 -147.2 -65.0 179.9 23 C -73.5 -174.3 50.4 81.0 -147.7 -77.2 -161.6 24 U -58.9 171.8 50.4 79.4 -154.6 -59.8 -165.6 25 C 156.8 -167.0 -177.2 81.5 -171.3 -74.4 -169.4 26 A 153.9 -179.9 -169.9 81.2 -139.3 -75.9 175.6 27 G 167.5 -137.4 151.6 82.4 -117.0 127.7 179.4 28 G 32.3 158.0 -50.2 144.0 21.0 -87.2 -91.4Then, the same pipeline was used for the three experimental DNA structures given in the previous task (PDB IDs: 1TNE, 1BNA and 3V9D). For the sake of simplicity, only the delta torsion angles of the three DNA forms and the tRNA structure were compared. The average delta angle, calculated via Excel, clearly suggests close structure similarity between the tRNA and the A-DNA (PDB ID: 3V9D). A link to the Excel file is given below. Excel table Hydrogen bondsThe collection of all the base pairs in the tRNA structure, as obtained via the pipeline mentioned earlier, is presented below:
            Strand I                    Strand II          Helix
   1   (0.067) ....>P:...2_:[GTP]g-----C[..C]:..71_:P<.... (0.003)     |
   2   (0.004) ....>P:...3_:[..G]G-----C[..C]:..70_:P<.... (0.004)     |
   3   (0.001) ....>P:...4_:[..G]G-----C[..C]:..69_:P<.... (0.002)     |
   4   (0.003) ....>P:...5_:[..A]A-----U[..U]:..68_:P<.... (0.002)     |
   5   (0.001) ....>P:...6_:[..U]U-----A[..A]:..67_:P<.... (0.003)     |
   6   (0.003) ....>P:...7_:[..U]U-----A[..A]:..66_:P<.... (0.002)     |
   7   (0.006) ....>P:..49_:[..C]C-----G[..G]:..65_:P<.... (0.003)     |
   8   (0.002) ....>P:..50_:[..U]U-----A[..A]:..64_:P<.... (0.003)     |
   9   (0.002) ....>P:..51_:[..G]G-----C[..C]:..63_:P<.... (0.003)     |
  10   (0.003) ....>P:..52_:[..U]U-----A[..A]:..62_:P<.... (0.005)     |
  11   (0.004) ....>P:..53_:[..G]G-----C[..C]:..61_:P<.... (0.004)     |
  12   (0.003) ....>P:..54_:[..U]U-**--A[..A]:..58_:P<.... (0.002)     |
  13   (0.004) ....>P:..55_:[..U]U-**+-G[..G]:..18_:P<.... (0.003)     x
  14   (0.008) ....>P:..35_:[..A]A-**--U[..U]:..33_:P<.... (0.005)     |
  15   (0.004) ....>P:..38_:[..A]A-**--C[..C]:..32_:P<.... (0.014)     |
  16   (0.006) ....>P:..39_:[..U]U-----A[..A]:..31_:P<.... (0.006)     |
  17   (0.004) ....>P:..40_:[..C]C-----G[..G]:..30_:P<.... (0.004)     |
  18   (0.003) ....>P:..41_:[..U]U-----A[..A]:..29_:P<.... (0.003)     |
  19   (0.005) ....>P:..42_:[..G]G-----C[..C]:..28_:P<.... (0.003)     |
  20   (0.002) ....>P:..43_:[..G]G-----C[..C]:..27_:P<.... (0.004)     |
  21   (0.003) ....>P:..44_:[..A]A-**--G[..G]:..26_:P<.... (0.003)     |
  22   (0.008) ....>P:..10_:[..G]G-----C[..C]:..25_:P<.... (0.007)     |
  23   (0.009) ....>P:..11_:[..C]C-----G[..G]:..24_:P<.... (0.002)     |
  24   (0.002) ....>P:..12_:[..U]U-----A[..A]:..23_:P<.... (0.003)     |
  25   (0.005) ....>P:..13_:[..C]C-----G[..G]:..22_:P<.... (0.005)     |
  26   (0.004) ....>P:..14_:[..A]A-**--U[..U]:...8_:P<.... (0.004)     |
  27   (0.004) ....>P:..15_:[..G]G-**+-C[..C]:..48_:P<.... (0.002)     x
  28   (0.014) ....>P:..19_:[..G]G-----C[..C]:..56_:P<.... (0.004)     +
As stems include only the canonical (Watson-Crick) nucleobase interactions*, the base pairs constituting the stems have the numbers 1-6, 7-11, 16-20 and 22-25 (4 stems overall). The
nucleotide numbers (of the nucleotides composing the stems) are 2-7, 10-13, 22-25, 27-31, 39-43, 49-53 and 61-71.There are 7 non-Watson-Crick base pairs in this structure: 12-15, 21 and 26-27. (among these are G-U, A-C and A-G) All the base pairs, which are not involved in stem formation, stabilize the tertiary structure of the tRNA. These ones have the numbers 12-15, 21 and 26-28. *"A stem is defined as a helix consisting of only canonical WC/wobble pairs, with a continuous backbone." Source: x3DNA.org StackingIn this section one can find an image representing the stacking interactions in the "Step 11" part of the tRNA structure. This step was chosen because it had the largest total overlap.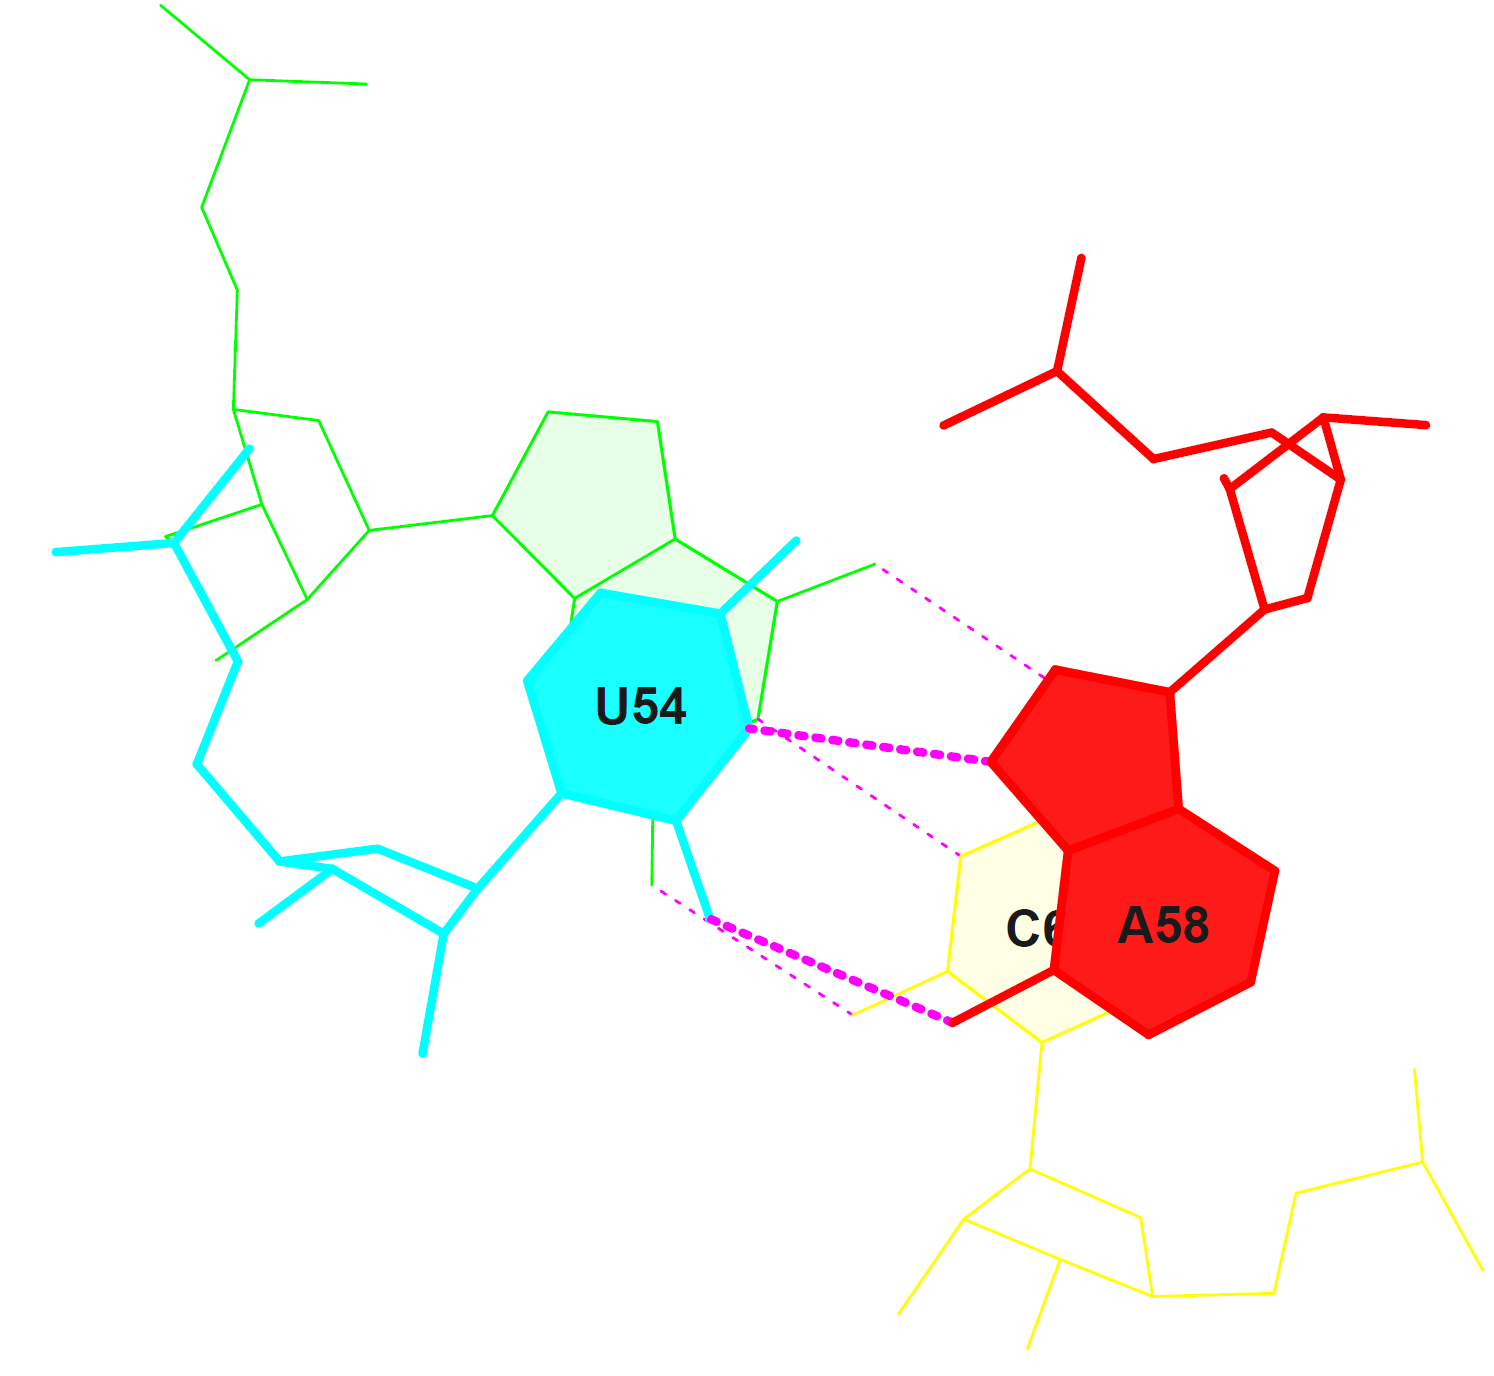
|
© Stanislav Tikhonov, 2018