|
Home page Term 1 Term 2 Term 3 About me Faculty website |
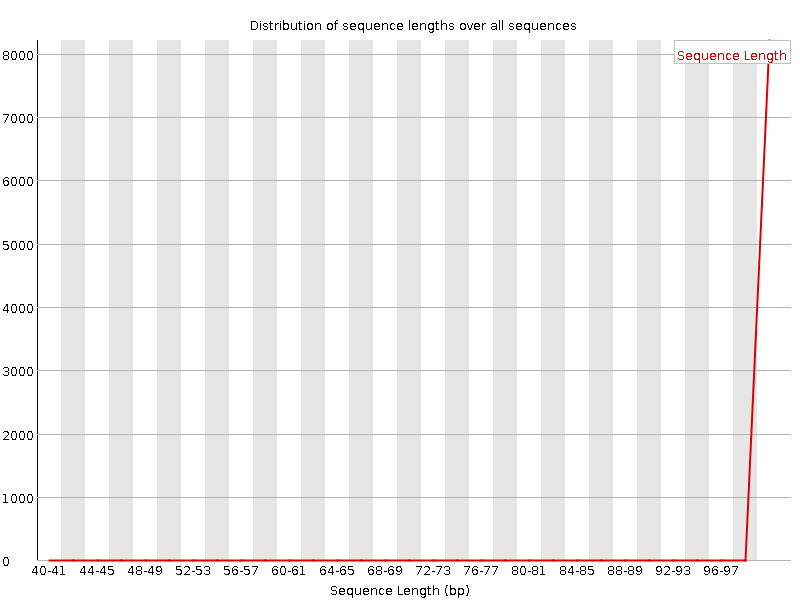
Sequencing data analysisTHERE IS A TABLE WITH ALL THE COMMANDS USED AT THE END OF THE WEBPAGERead quality analysisAccording to the output of the FastQC program, the given single-end reads have a high quality. There are warnings in the "Per base sequence content" (a little wobble there, mostly in the left-hand region, presumably caused by primers), "Per sequence GC content", and "Sequence length distribution" sections of the FastQC report, displaying some minor contaminations of the sample, but overall it can be concluded that the quality is high.FastQC report In the "Sequence length distribution" section there was a warning, although the plot clearly shows that there are only sequences with lengths of around 100. To clarify the cause of the warning, I opened the fastqc_data.txt file from the .zip archive, and it showed that there actually is one short read, though not seen in the diagram:
Trimming and discarding poor quality or inappropriately short readsThis is a diagram displaying per base quality before the application of Trimmomatic: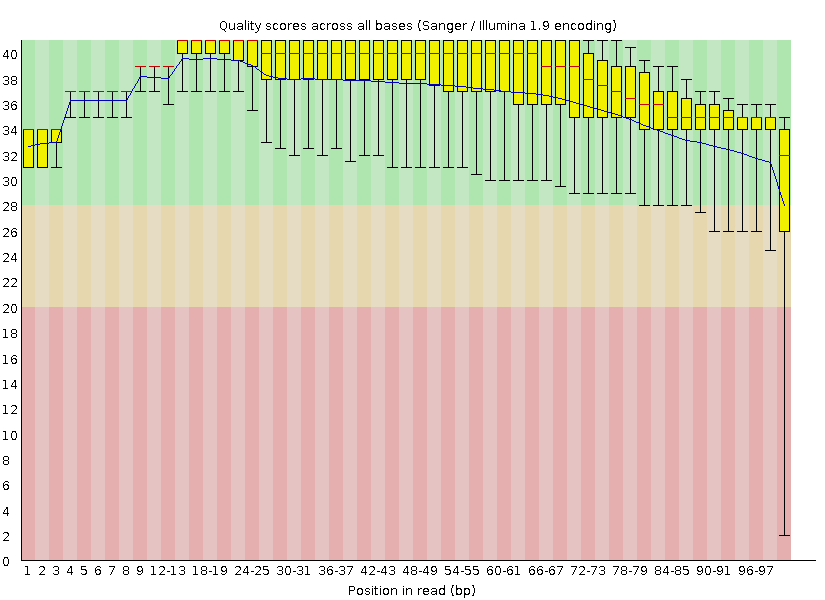 When the Trimmomatic program was launched with the parameters specified in the task (minimum length 50 and minimum quality 20), the resulting .fastq file happened to be much worse than the original one. The TRAILING parameter turned out to trim reads with low quality bases in the middle of the sequence, creating many short "reads" and thus lowering the overall quality of the sequencing data (the GC content section gave a fail instead of a warning), although the diagram in "Per base quality" section did not show low quality bases any more: FastQC report after incorrect trimming Afterwards, another trimming was performed with MINLEN set to 100. Such parameters neither allowed those short pseudoreads to contaminate the sequencing data, nor deleted any significant data since all the reads except one were 100 nt long in the original .fastq file. Thus, I ended up with 7049 100-nt-long reads (instead of 8207 in the original file). Below there is the "Per base quality" diagram from the correctly trimmed set of reads together with the complete FastQC report, which showes an improved quality: 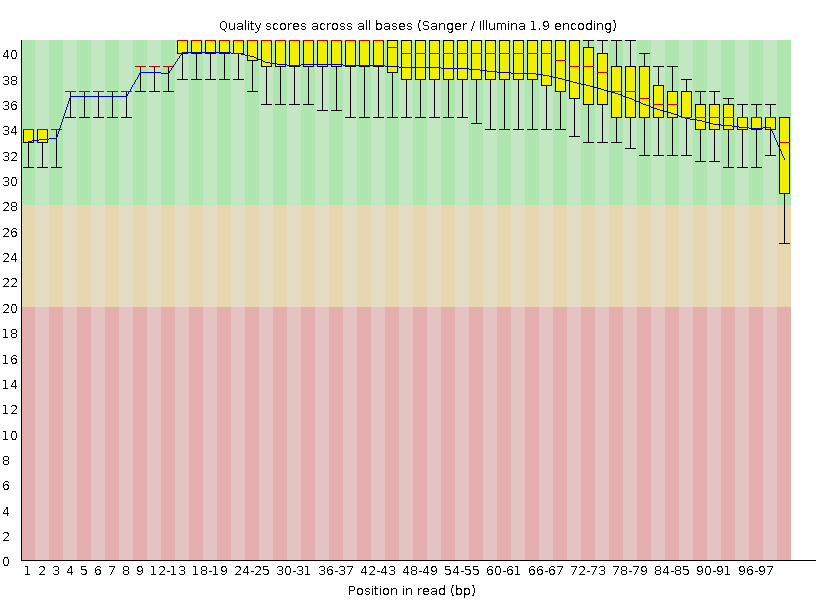 FastQC report after correct trimming There were 8208 reads (including the one short read) in the original file and 7049 reads in the resulting file. This is the distribution of read length after the use of Trimmomatic (now there is no warning in this section): 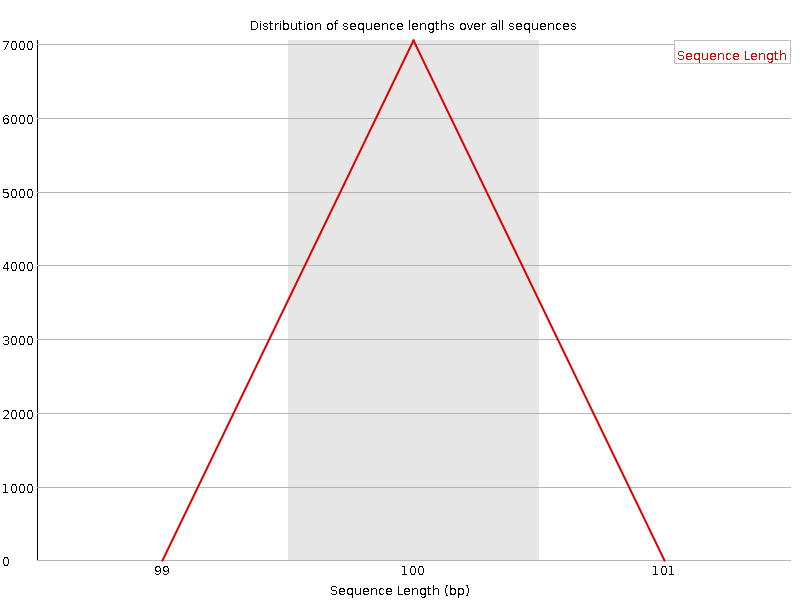
Mapping the readsThis was the output of the hisat2 program.
7049 reads; of these:
  7049 (100.00%) were unpaired; of these:
    22 (0.31%) aligned 0 times
    7027 (99.69%) aligned exactly 1 time
    0 (0.00%) aligned >1 times
99.69% overall alignment rate
Below there is a .sam file containing those 7027 reads mapped to the reference sequence (chr5.fasta):Alignment Alignment analysisThe binary file returned by samtools view: mapped_reads.bamThe binary file returned by samtools sort: mapped_reads_sorted.bam Indexed file produced by samtools index: mapped_reads_sorted.bam.bai 7049 reads were mapped to the chromosome sequence, 22 were not. Additional information from hisat2 can be found above or in the .sam file produced by it (link in the previous section). SNP analysisThree SNPs from the pileup.vcf file:
There are 31 polymorphisms altogether: 4 indels and 27 SNPs. Depth varies from one read to 138 (median 26, which is OK). Quality varies from 8.64911 to 225.009 whith the median of 179.009, which is quite a high quality (these data were obtained via Excel). RefSeq SNP typesSNP are classified by Annovar according to their position as follows:
Annotation analysisAnnovar with RefGene found the following types among the ones being analyzed (information from the .variant_function file):
The same file provided information about which genes do the SNPs happen to be in:
According to the files returned by annovar with DBSNP, 24 SNPs have rs. According to the output of the annovar with 1000Genomes, the mean frequency of occurence of SNPs is 0.417897. Clinical annotation of some SNPs was returned by annovar with GWAS:
Here one can find an Excel table summarizing all the data obtained from the annotation. Table with all the commands used
|
© Stanislav Tikhonov, 2018