Task 1
Using 3DNA A, B and Z DNA forms were created (sequence is GATC repeated 5 times for A and B forms and GC repeated 10 times for Z form).
Task 2
Main parameters of studied DNA forms
| A form | B form | Z form | |
| Helix | Right-handed | Right-handed | Left-handed |
| Length per turn | 28.03 Å | 33.7 Å | 43.5 Å |
| Amount of bases per turn | 11 | 10 | 12 |
| Minor groove width | 16.97 Å [DC]32:B.P #638 - [DC]12:A.P #228 | 13.2 Å [DC]32:B.P #638 - [DA]14:A.P #269 | 9.87 Å [DG]33:B.P #657 - [DC]12:A.P #228 |
| Major groove width | 7.98 Å [DG]33:B.P #657 - [DA]2:A.P #23 | 17.21 Å [DC]5:A.P #64 - [DC]33:B.P #638 | 16.08 Å [DC]28:B.P #556 - [DC]12:A.P #228 |
Major and minor grooves
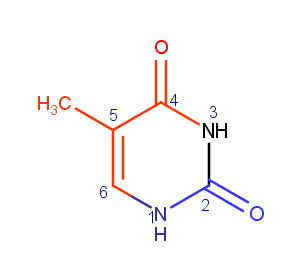
Major groove contains C4 and O4, C5, C6, C7 atoms (of thymine). Minor groove contains N1, C2 and O2 atoms (of thymine). In Fig. 1, atoms that are located in major groove are colored red, atoms that are located in minor groove are colored blue.
Task 3
Torsion angles
Average difference of torsion angles between both strands of tRNA and A, B and Z DNA forms was calculated. It is clearly seen that studied tRNA is similar to A form of DNA.
| alpha | beta | gamma | delta | epsilon | zeta | chi | |
| Strand I | |||||||
| tRNA | -26,63 | 87,82 | 52,23 | 85,28 | -121,45 | -54,79 | -149,20 |
| A form | -36,84 | 66,57 | 33,96 | 83,56 | -131,98 | -72,1 | -164,53 |
| Difference with tRNA | 10,21 | 21,25 | 18,27 | 1,71 | 10,53 | 17,31 | 15,33 |
| Average difference | 13,52 | ||||||
| B form | -64,036 | 71,18 | 65,52 | 125,45 | -2,12 | -79,19 | -115,975 |
| Difference with tRNA | 37,41 | 16,64 | 13,29 | 40,17 | 119,34 | 24,40 | 33,23 |
| Average difference | 40,64 | ||||||
| Z form | 46,52 | -95,62 | -0,98 | 121,13 | -118,36 | 42,24 | -49,45 |
| Difference with tRNA | 73,15 | 183,44 | 53,21 | 35,85 | 3,09 | 97,03 | 99,75 |
| Average difference | 77,93 | ||||||
| Strand II | |||||||
| tRNA | -46,85 | 26,225 | 66,14 | 88,88 | -99,85 | -76,37 | -116,99 |
| A form | -41,45 | 34,02 | 32,83 | 86,88 | -160,23 | -71,53 | -115,25 |
| Difference with tRNA | 5,39 | 7,79 | 33,31 | 2 | 60,38 | 4,84 | 1,74 |
| Average difference | 16,49 | ||||||
| B form | -61,56 | 75,15 | 53,475 | 120,01 | 56,85 | -72,25 | -118,525 |
| Difference with tRNA | 14,71 | 48,92 | 12,66 | 31,13 | 156,71 | 4,12 | 1,54 |
| Average difference | 38,54 | ||||||
| Z form | 46,54 | -95,64 | -0,97 | 121,13 | -118,34 | 42,22 | -49,43 |
| Difference with tRNA | 93,39 | 121,865 | 67,10 | 32,25 | 18,49 | 118,59 | 67,55 |
| Average difference | 74,18 | ||||||
Hydrogen bonds in tRNA
Four stems were discovered in studied structure. Their description is given below.
| Strand I | Strand II | Helix | |||
| 1 | (0.015) | ....>B:...2_:[..G]G- | ---C[..C]:..71_:B<.... | (0.014) | | |
| 2 | (0.012) | ....>B:...3_:[..G]G- | ---C[..C]:..70_:B<.... | (0.005) | | |
| 3 | (0.017) | ....>B:...4_:[..G]G- | ---C[..C]:..69_:B<.... | (0.010) | | |
| 4 | (0.012) | ....>B:...5_:[..G]G- | ---C[..C]:..68_:B<.... | (0.008) | | |
| 5 | (0.020) | ....>B:...6_:[..U]U- | ---A[..A]:..67_:B<.... | (0.011) | | |
| 6 | (0.011) | ....>B:...7_:[..A]A- | ---U[..U]:..66_:B<.... | (0.014) | | |
| 7 | (0.017) | ....>B:..49_:[..C]C- | ---G[..G]:..65_:B<.... | (0.010) | | |
| 8 | (0.021) | ....>B:..50_:[..G]G- | ---C[..C]:..64_:B<.... | (0.008) | | |
| 9 | (0.009) | ....>B:..51_:[..A]A- | ---U[..U]:..63_:B<.... | (0.017) | | |
| 10 | (0.012) | ....>B:..52_:[..G]G- | ---C[..C]:..62_:B<.... | (0.012) | | |
| 11 | (0.010) | ....>B:..53_:[..G]G- | ---C[..C]:..61_:B<.... | (0.007) | | |
| 16 | (0.014) | ....>B:..39_:[..U]U- | ---A[..A]:..31_:B<.... | (0.011) | | |
| 17 | (0.011) | ....>B:..40_:[..C]C- | ---G[..G]:..30_:B<.... | (0.008) | | |
| 18 | (0.010) | ....>B:..41_:[..C]C- | ---G[..G]:..29_:B<.... | (0.012) | | |
| 19 | (0.008) | ....>B:..42_:[..G]G- | ---C[..C]:..28_:B<.... | (0.009) | | |
| 20 | (0.010) | ....>B:..43_:[..G]G- | ---C[..C]:..27_:B<.... | (0.008) | | |
| 22 | (0.014) | ....>B:..10_:[..G]G- | ---C[..C]:..25_:B<.... | (0.008) | | |
| 23 | (0.009) | ....>B:..11_:[..C]C- | ---G[..G]:..24_:B<.... | (0.016) | | |
| 24 | (0.010) | ....>B:..12_:[..C]C- | ---G[..G]:..23_:B<.... | (0.015) | | |
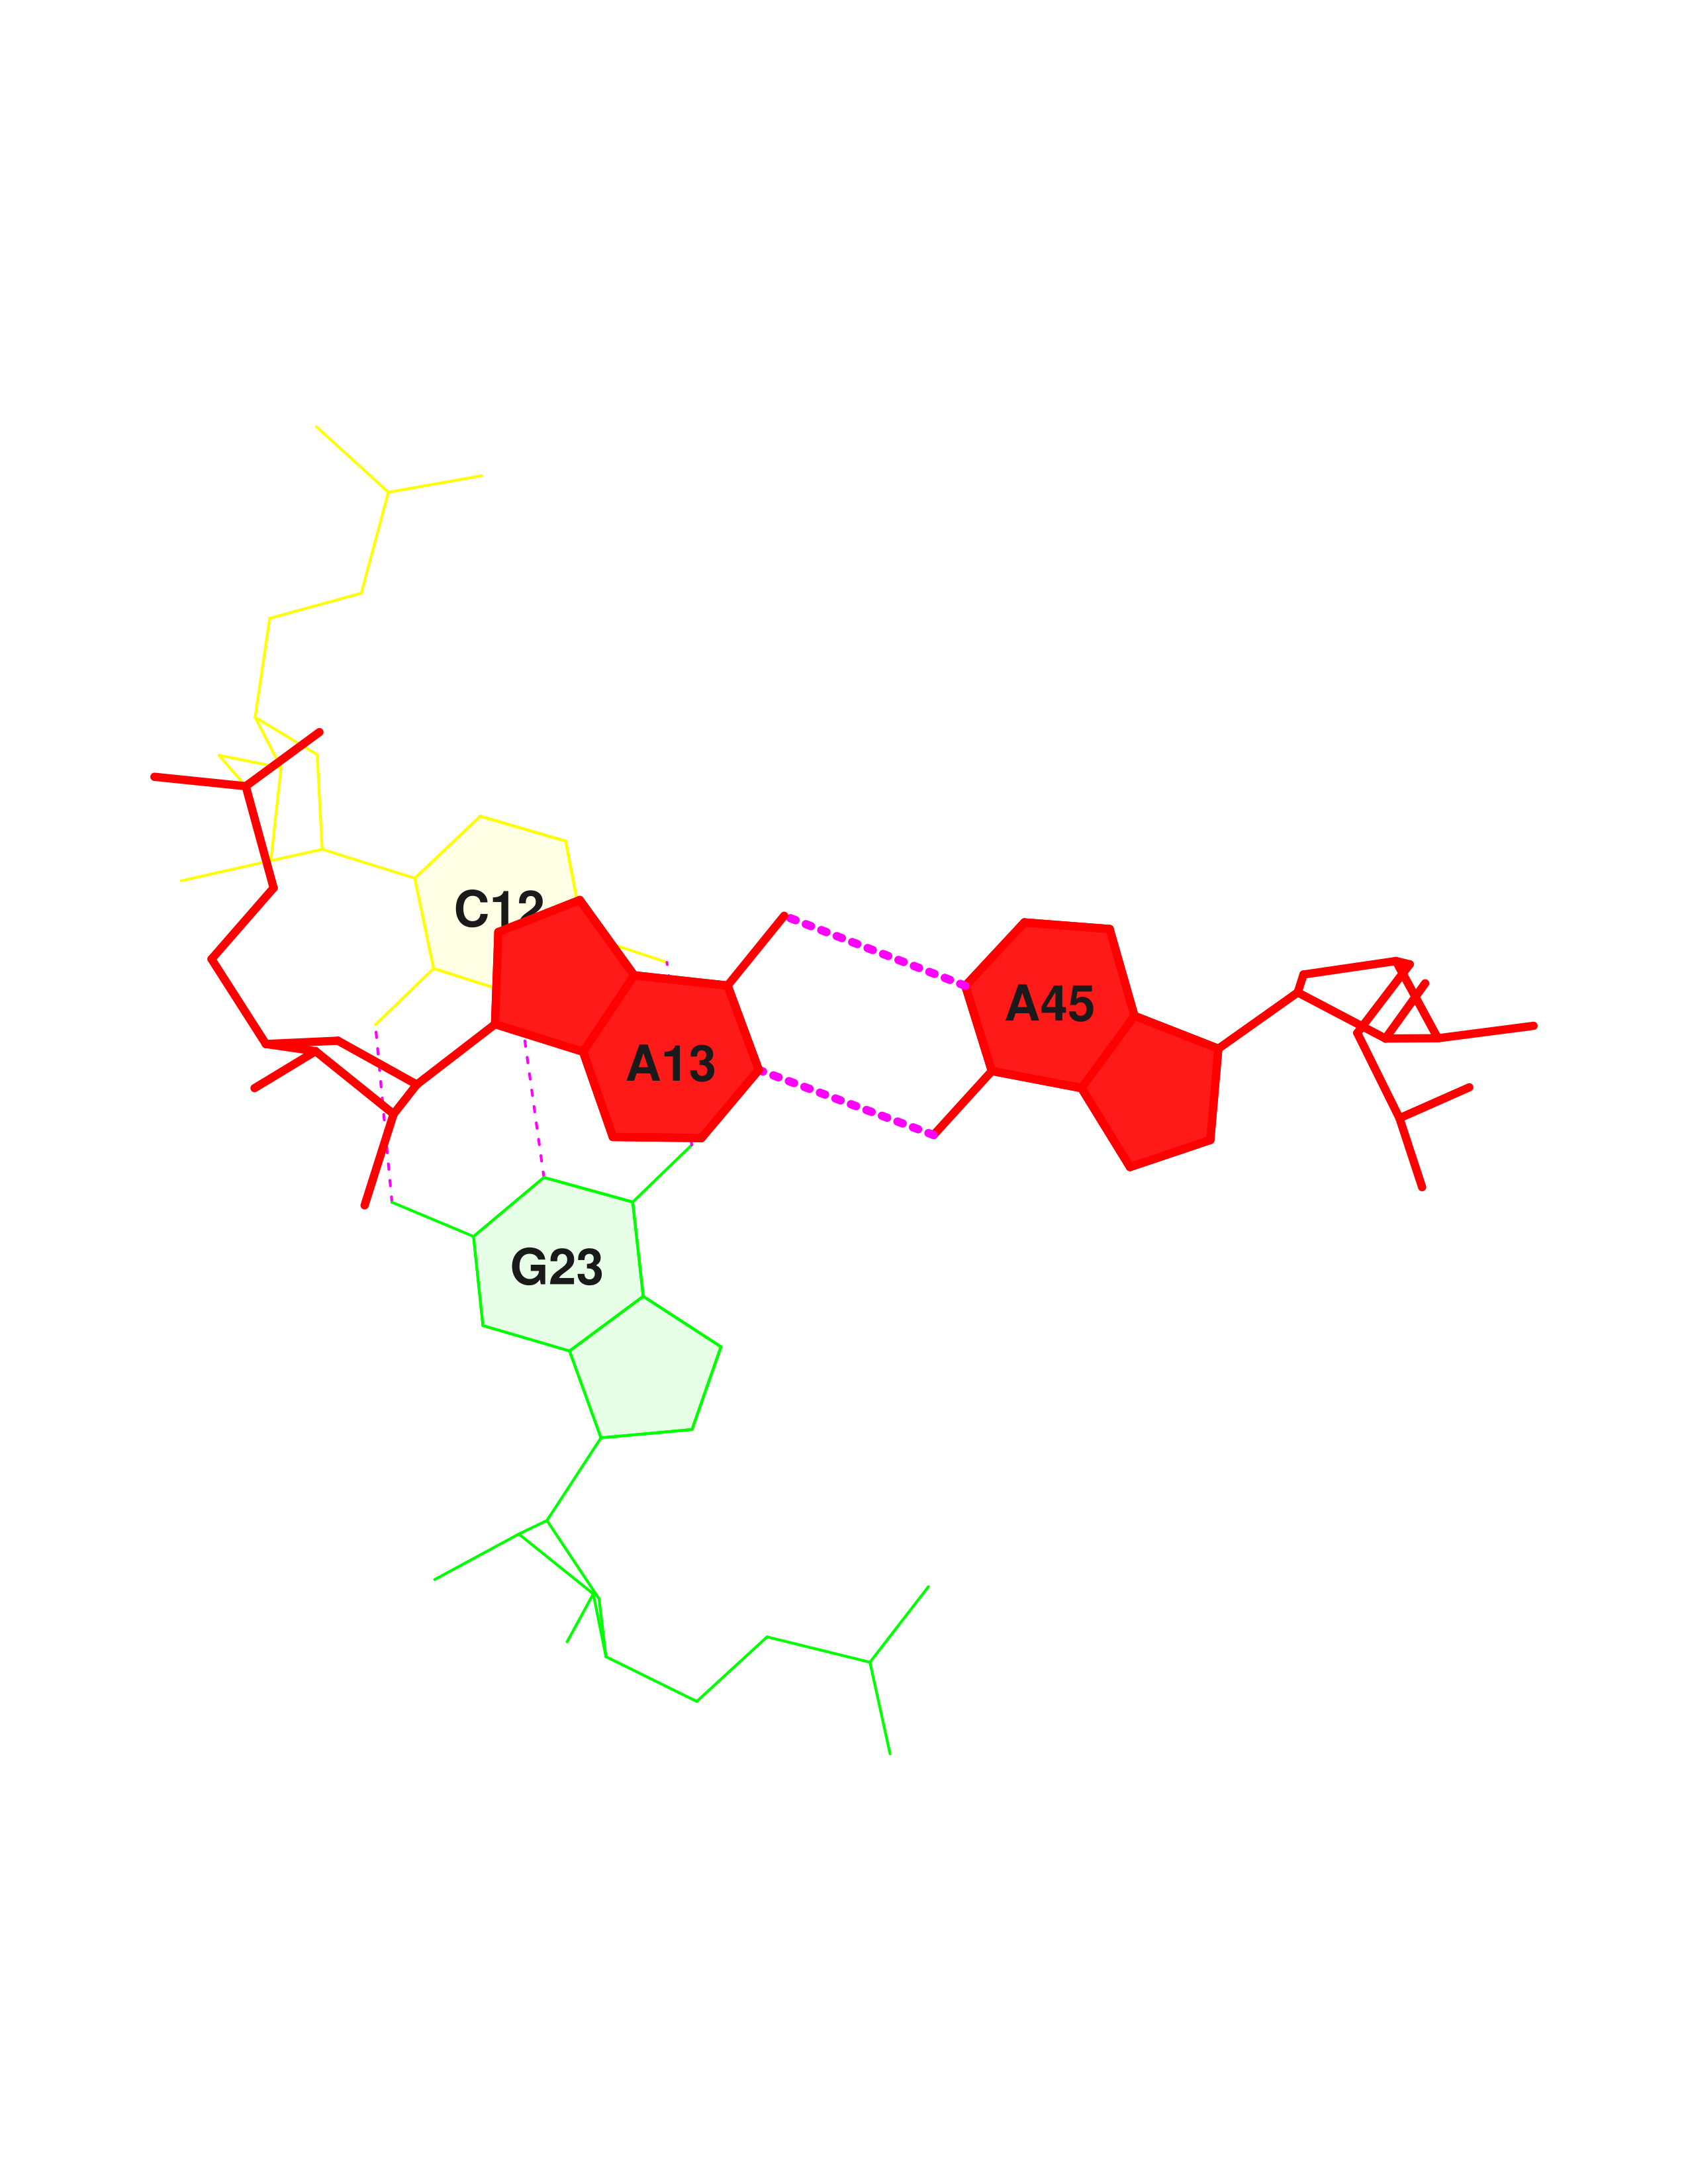
Using .out file it was discovered that studied structure contains 4 non-Watson-Crick base-pairs:
| 13 | (0.015) | ....>B:..55_:[..U]U- | *+-G[..G]:..18_:B<.... | (0.014) | x |
| 15 | (0.018) | ....>B:..38_:[..U]U- | ---U[..U]:..32_:B<.... | (0.019) | | |
| 21 | (0.012) | ....>B:..44_:[..C]C- | *--A[..A]:..26_:B<.... | (0.014) | | |
| 25 | (0.010) | ....>B:..13_:[..A]A- | *+-A[..A]:..45_:B<.... | (0.012) | | |
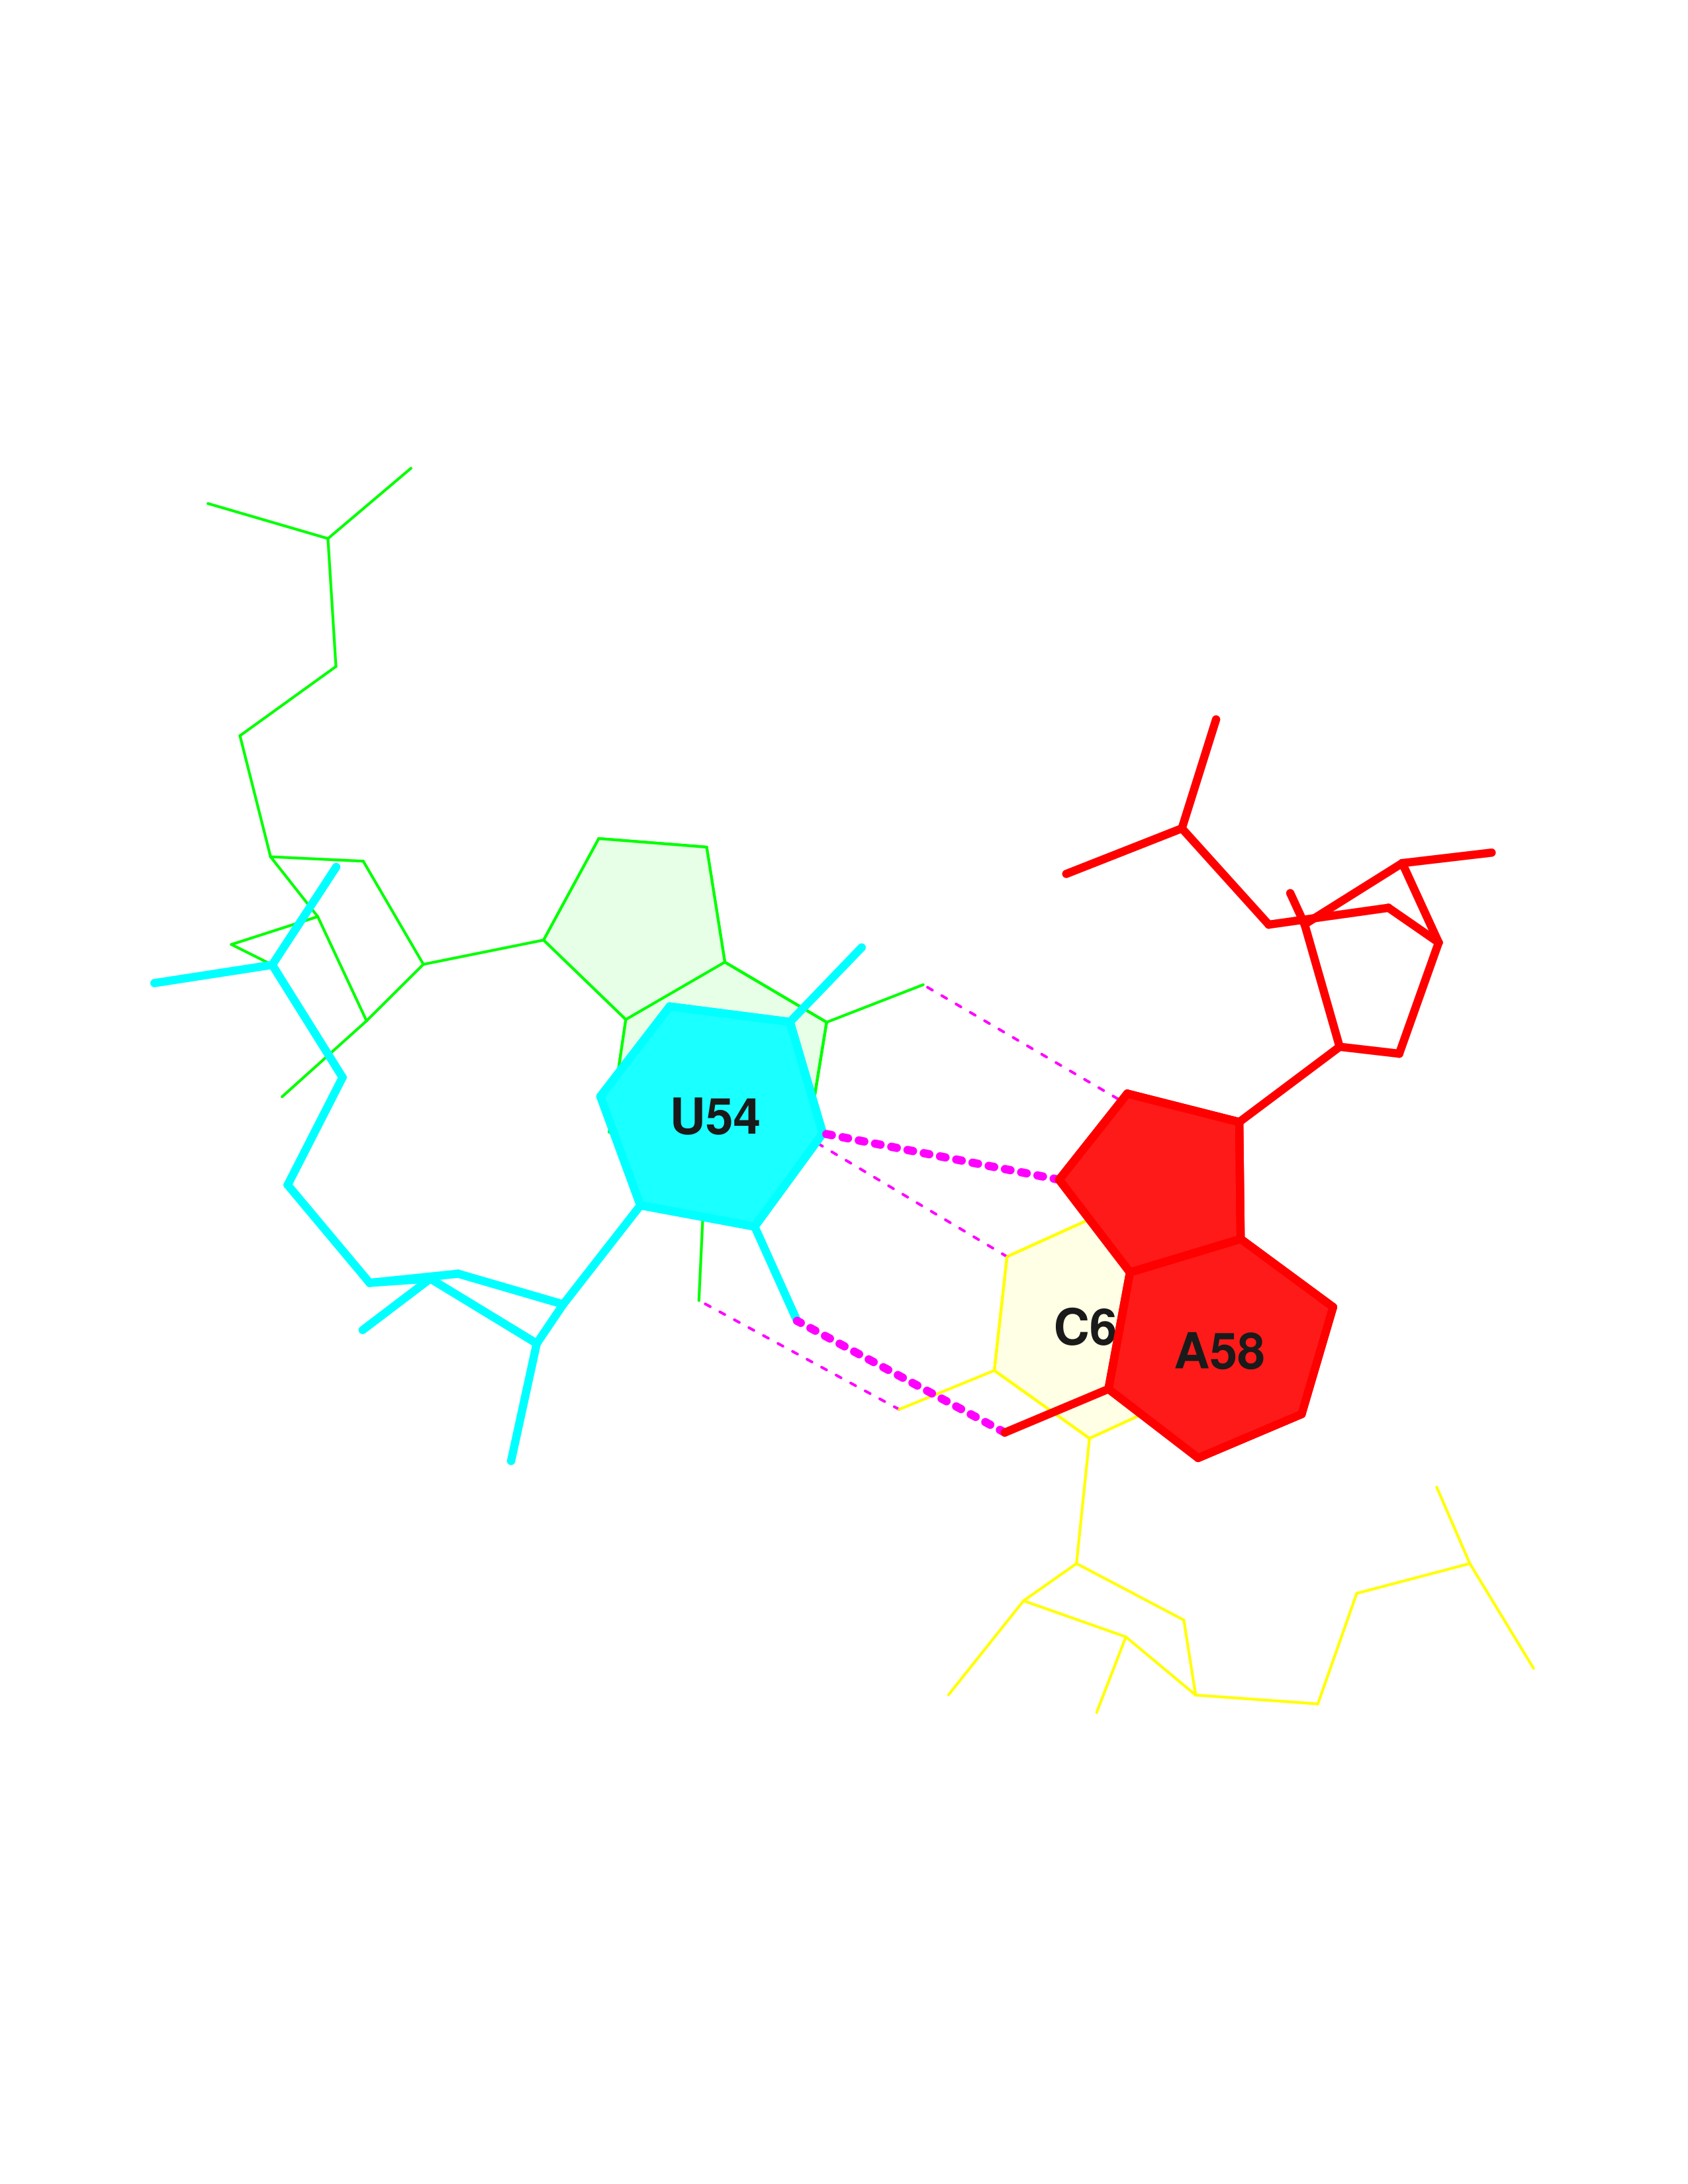
Stabilising hydrogen bonds were also determined:
| 12 | (0.009) | ....>B:..54_:[..U]U- | *--A[..A]:..58_:B<.... | (0.011) | | |
| 13 | (0.015) | ....>B:..55_:[..U]U- | *+-G[..G]:..18_:B<.... | (0.014) | x |
| 14 | (0.010) | ....>B:..37_:[..A]A- | *--U[..U]:..33_:B<.... | (0.017) | | |
| 15 | (0.018) | ....>B:..38_:[..U]U- | ---U[..U]:..32_:B<.... | (0.019) | | |
| 21 | (0.012) | ....>B:..44_:[..C]C- | *--A[..A]:..26_:B<.... | (0.014) | | |
| 25 | (0.010) | ....>B:..13_:[..A]A- | *+-A[..A]:..45_:B<.... | (0.012) | | |
| 26 | (0.013) | ....>B:..14_:[..A]A- | *--U[..U]:...8_:B<.... | (0.030) | | |
| 27 | (0.013) | ....>B:..15_:[..G]G- | *+-C[..C]:..48_:B<.... | (0.011) | x |
| 28 | (0.015) | ....>B:..19_:[..G]G- | ---C[..C]:..56_:B<.... | (0.009) | + |
Stacking interactions
.out file were analyzed and stacking interactions were found.
   step      i1-i2        i1-j2        j1-i2        j1-j2        sum
11 GU/AC  6.64( 3.76)  0.00( 0.00)  0.00( 0.00)  4.74( 1.88) 11.38( 5.63)
24 CA/AG  0.00( 0.00)  0.00( 0.00)  0.00( 0.00)  0.00( 0.00)  0.00( 0.00)
According to these lines max overlap area is 11.38 Å^2 between GU/AC residues, min is 0.00 between CA/AG pairs.
Excel file
Excel file containing information about torsion angles and stems.