| FBB MSU site | Main page | About me | Terms |
HMM profile. ROC curve.
Task 1
From pr6 I took protein family of enolases.
Family: Enolase_C (PF00113)
I will make profile among enolases of kingdom Fungi.
Uniprot query:
database:(type:pfam id:PF00113) taxonomy:" Fungi 4751" AND reviewed:yes
Columns in Uniprot output table:
- Entry name
- Length
- Fragment
- Protein names
- Pfam (Family and domain)
- Taxonomic lineage (KINGDOM)
Sequenses were downloaded in TAB and FASTA. Then they were aligned.
There are 29 sequences fit to query so I will make profile on them. Alignment you can see here: align_need_seqs.jvp / align_need_seqs.fasta (Tcoffee with Defaults, color by Clustal, conservation 58).
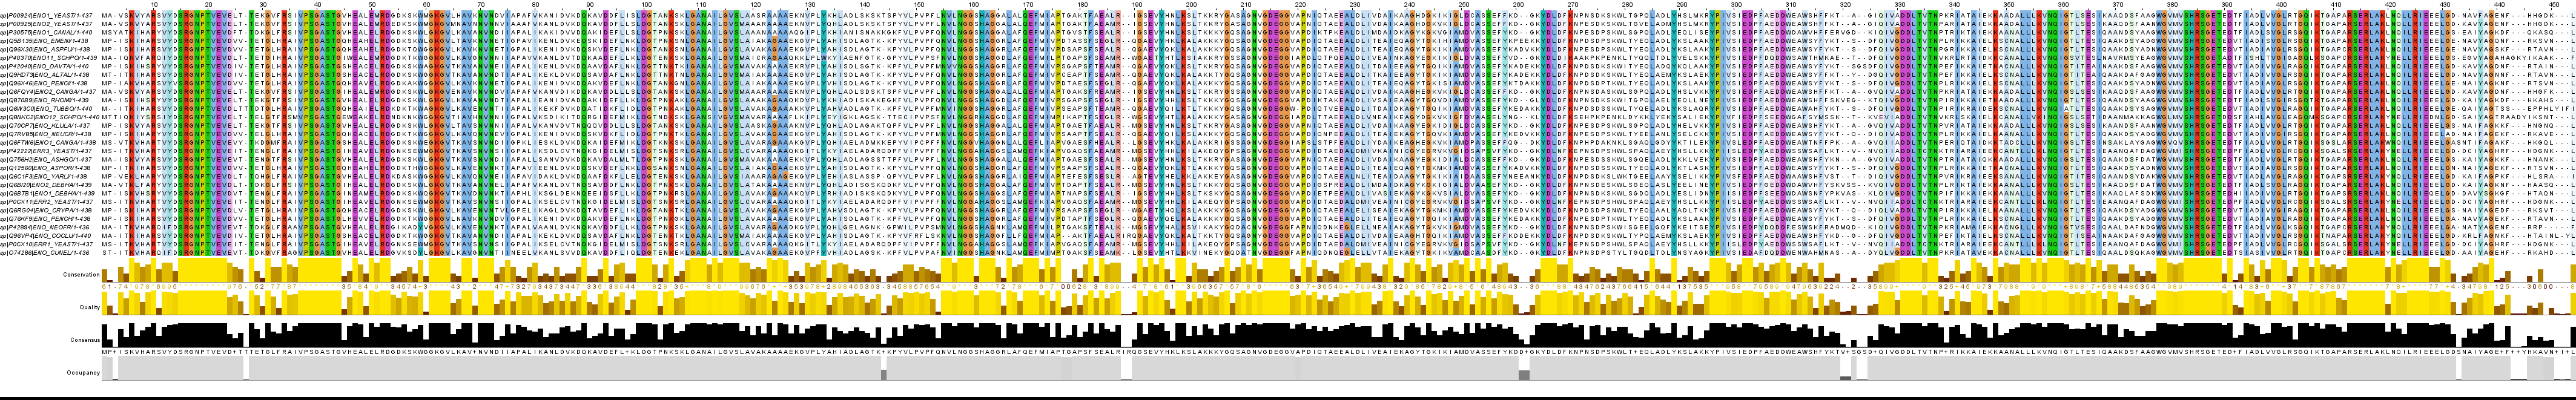
Figure 1. Alignment of fungi enolases.
Task 2
Commands for profile creation and calibration:
hmm2build -g profile.out align_need_seqs.fasta
hmm2calibrate profile.out
Output file: profile.out.
Task 3
Search using a profile in the database Swissprot:
hmm2search --domE 1000 --domT -50 profile.out /srv/databases/emboss/data/uniprot/uniprot_sprot.fasta > search-50.txtdomE - the threshold E-value for alignment of domains (threshold E-value = 1000 is tantamount to lack of threshold E-value)
domT - the threshold score for alignment of domains (threshold score = -50 is very small value)
Output file: search-50.txt.
 |
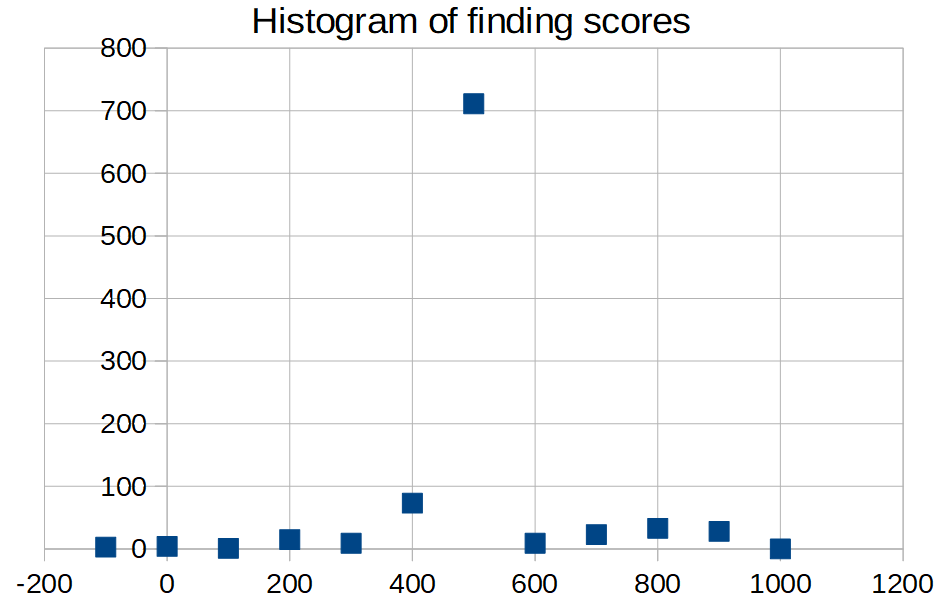 |
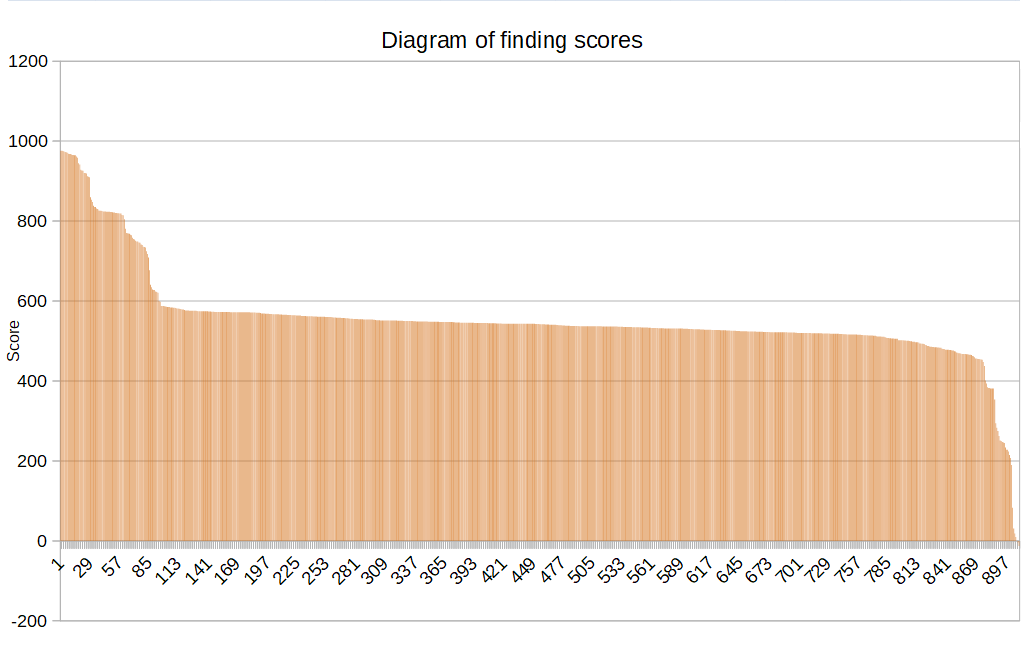
| Figure 2. Diagram of finding scores. | Figure 3. Histogram of finding scores. Bin size = 100. |
There isn't clearly threshold value of score. Only the first small step separates the correct 29 findings from the 880 wrong.
Task 4
The result table is here: table_pr8.ods.
Table 1. Data for cutoff choise.
| cutoff | TP | FP | FN | TN | Sensitivity | Specificity | 1-Specificity | PPV |
| -0.6 | 29 | 877 | 0 | 3 | 1 | 0.003 | 0.997 | 0.032 |
| 82.8 | 29 | 873 | 0 | 7 | 1 | 0.008 | 0.992 | 0.032 |
| 189.5 | 29 | 872 | 0 | 8 | 1 | 0.009 | 0.991 | 0.032 |
| 294.2 | 29 | 858 | 0 | 23 | 1 | 0.026 | 0.974 | 0.033 |
| 393.4 | 29 | 849 | 0 | 32 | 1 | 0.036 | 0.964 | 0.033 |
| 499.9 | 29 | 776 | 0 | 104 | 1 | 0.118 | 0.882 | 0.036 |
| 599.8 | 29 | 65 | 0 | 815 | 1 | 0.926 | 0.074 | 0.309 |
| 676.7 | 29 | 56 | 0 | 824 | 1 | 0.936 | 0.064 | 0.3412 |
| 781.1 | 29 | 33 | 0 | 857 | 1 | 0.963 | 0.037 | 0.468 |
| 859.3 | 28 | 0 | 1 | 880 | 0.966 | 0.5 | 0.5 | 0.031 |
 |
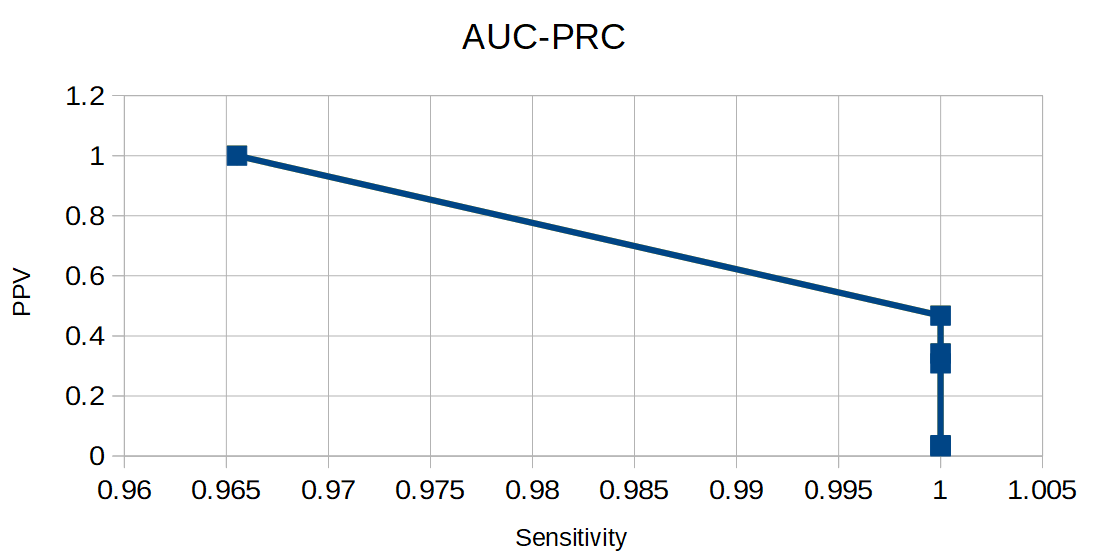 |
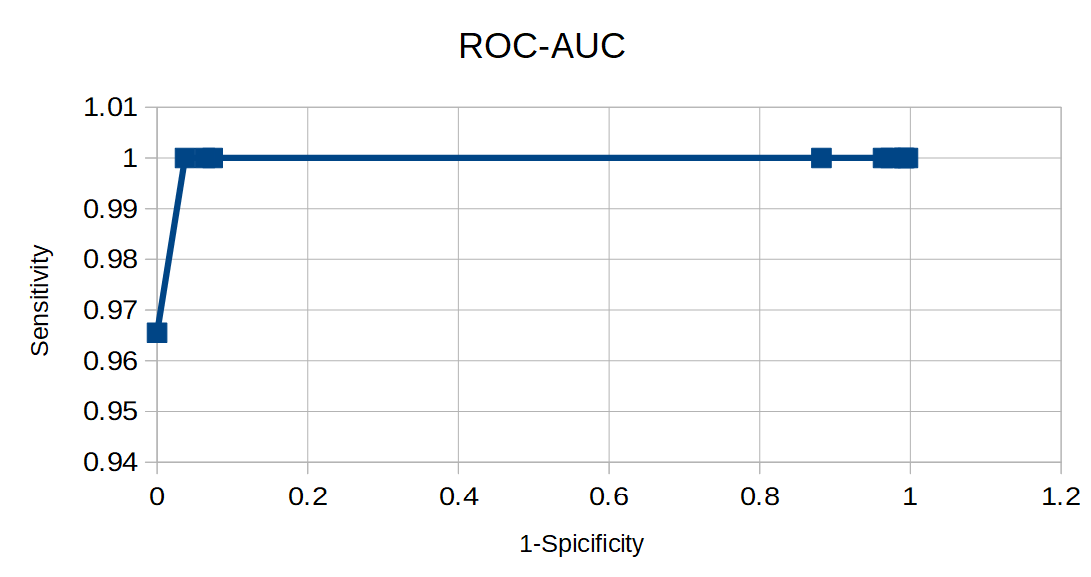
| Figure 4. ROC-AUC. | Figure 5. AUC-PRC. |
If we want to find absolutely all representatives of the selected taxon we should take Cutoff = 859.3. If we don't want to find any wrong sequences we should take Cutoff = 853.3.
|
Table 2. Chosen cutoff parametres - 1.
|
Table 3. Chosen cutoff parametres - 2.
|
Conclusion:
The profile isn't very useful. It was build out of a too less number of sequences. Moreover the chosen taxon is not numerous and it is also possible that the domain is very conserved so the fungi it is not much different from the rest.
This profile still can used but we need to take the findings with extremely large scores.
| Term 4 |
| ← Pr 7 | → Block 3. |
© Darya Potanina, 2017